0x01 前言
我终于要淘汰了我的HP DL380 G6,因为需要控制用电量,我决定将380 G6下架并送给一位朋友。在送出去之前,我再进行一次性能测试,留下美好的回忆。
0x02 测试内容
目前服务器内有4块硬盘,全都是HP的300G硬盘;18根DDR3 ECC REG 4G内存。
目前磁盘的整列级别为RAID 5,我会装上Centos 7,分别测试磁盘与整体性能;然后重新配置RAID为10,再重复以上测试。
完成以上测试后会进行用电量测试,首先是在禁用Power Capping的情况下分别记录0负载与100%负载的用电情况;然后根据之前测试的最高电功率配置Power Capping为60%,再重复100%负载的测试与整体性能测试,以便比对用电量与整体分数。
简单来说,测试内容有以下几项:
- RAID 5的环境中测试磁盘性能;
- RAID 10的环境中测试磁盘性能;
- 禁用Power Capping,记录0负载时的功率;
- 禁用Power Capping,记录100%负载时的功率;
- 禁用Power Capping,测试整体性能。
- 设置Power Capping为50%,记录100%负载时的功率;
- 设置Power Capping为50%,测试整体性能。
首先需要确认硬件是否处于正常状态:

除了有一个散热风扇处于离线状态外,还有因为一块磁盘接触不良而离线导致整列处于重建阶段。
等重建完成后再开始测试。
最后,以下是我服务器的硬件信息:
- CPU:2颗L5630
- 内存:12根DDR3 ECC REG 4G
- 硬盘:4个300G HP迅猛龙硬盘
0x03 测试
0x03.1 RAID 5的环境中测试磁盘性能
[root@380p1 temp]# dd bs=1M count=1024 if=/dev/zero of=1gb-1.test conv=fdatasync
1024+0 records in
1024+0 records out
1073741824 bytes (1.1 GB) copied, 3.79824 s, 283 MB/s

[root@380p1 temp]# dd bs=1M count=1024 if=/dev/zero of=1gb-2.test conv=fdatasync
1024+0 records in
1024+0 records out
1073741824 bytes (1.1 GB) copied, 3.64858 s, 294 MB/s

[root@380p1 temp]# dd bs=1M count=1024 if=/dev/zero of=1gb-3.test conv=fdatasync
1024+0 records in
1024+0 records out
1073741824 bytes (1.1 GB) copied, 3.75337 s, 286 MB/s

[root@380p1 temp]# dd bs=1M count=1024 if=/dev/zero of=1gb-4.test conv=fdatasync
1024+0 records in
1024+0 records out
1073741824 bytes (1.1 GB) copied, 3.77373 s, 285 MB/s

[root@380p1 temp]# dd bs=1M count=1024 if=/dev/zero of=1gb-5.test conv=fdatasync
1024+0 records in
1024+0 records out
1073741824 bytes (1.1 GB) copied, 3.69217 s, 291 MB/s
通过dd命令测试后发现磁盘速度大概在280m/s左右。
4k随机读写测试:
[root@380p1 ~]# fio -filename=/root/bench/test.fio  -direct=1 -rw=rw -bs=4k -size 1G -numjobs=8 -runtime=30 -group_reporting -name=file
file: (g=0): rw=rw, bs=(R) 4096B-4096B, (W) 4096B-4096B, (T) 4096B-4096B, ioengine=psync, iodepth=1
...
fio-3.6-31-g4386
Starting 8 processes
file: Laying out IO file (1 file / 1024MiB)
Jobs: 8 (f=6): [M(4),f(2),M(2)][100.0%][r=110MiB/s,w=110MiB/s][r=28.1k,w=28.3k IOPS][eta 00m:00s]
file: (groupid=0, jobs=8): err= 0: pid=31024: Sat May 12 17:31:49 2018
   read: IOPS=28.8k, BW=112MiB/s (118MB/s)(3370MiB/30001msec)
    clat (usec): min=50, max=76565, avg=134.70, stdev=159.60
     lat (usec): min=50, max=76565, avg=135.01, stdev=159.60
    clat percentiles (usec):
     |  1.00th=[   74],  5.00th=[   86], 10.00th=[   93], 20.00th=[  102],
     | 30.00th=[  109], 40.00th=[  113], 50.00th=[  117], 60.00th=[  123],
     | 70.00th=[  131], 80.00th=[  143], 90.00th=[  163], 95.00th=[  190],
     | 99.00th=[  570], 99.50th=[  693], 99.90th=[ 1516], 99.95th=[ 1614],
     | 99.99th=[ 2180]
   bw (  KiB/s): min=11144, max=17628, per=12.51%, avg=14385.93, stdev=1033.69, samples=473
   iops        : min= 2786, max= 4407, avg=3596.46, stdev=258.42, samples=473
  write: IOPS=28.8k, BW=112MiB/s (118MB/s)(3370MiB/30001msec)
    clat (usec): min=52, max=32825, avg=137.85, stdev=154.82
     lat (usec): min=52, max=32825, avg=138.30, stdev=154.82
    clat percentiles (usec):
     |  1.00th=[   77],  5.00th=[   89], 10.00th=[   96], 20.00th=[  105],
     | 30.00th=[  111], 40.00th=[  115], 50.00th=[  120], 60.00th=[  126],
     | 70.00th=[  135], 80.00th=[  145], 90.00th=[  165], 95.00th=[  194],
     | 99.00th=[  578], 99.50th=[  701], 99.90th=[ 1532], 99.95th=[ 1631],
     | 99.99th=[ 2212]
   bw (  KiB/s): min=11080, max=17440, per=12.51%, avg=14387.64, stdev=1024.63, samples=473
   iops        : min= 2770, max= 4360, avg=3596.89, stdev=256.15, samples=473
  lat (usec)   : 100=15.46%, 250=81.85%, 500=0.78%, 750=1.50%, 1000=0.11%
  lat (msec)   : 2=0.29%, 4=0.01%, 10=0.01%, 20=0.01%, 50=0.01%
  lat (msec)   : 100=0.01%
  cpu          : usr=3.47%, sys=23.50%, ctx=1782799, majf=0, minf=935
  IO depths    : 1=100.0%, 2=0.0%, 4=0.0%, 8=0.0%, 16=0.0%, 32=0.0%, >=64=0.0%
     submit    : 0=0.0%, 4=100.0%, 8=0.0%, 16=0.0%, 32=0.0%, 64=0.0%, >=64=0.0%
     complete  : 0=0.0%, 4=100.0%, 8=0.0%, 16=0.0%, 32=0.0%, 64=0.0%, >=64=0.0%
     issued rwts: total=862631,862839,0,0 short=0,0,0,0 dropped=0,0,0,0
     latency   : target=0, window=0, percentile=100.00%, depth=1

Run status group 0 (all jobs):
   READ: bw=112MiB/s (118MB/s), 112MiB/s-112MiB/s (118MB/s-118MB/s), io=3370MiB (3533MB), run=30001-30001msec
  WRITE: bw=112MiB/s (118MB/s), 112MiB/s-112MiB/s (118MB/s-118MB/s), io=3370MiB (3534MB), run=30001-30001msec

Disk stats (read/write):
    dm-1: ios=856135/856244, merge=0/0, ticks=98174/100093, in_queue=210473, util=100.00%, aggrios=862631/862871, aggrmerge=0/18, aggrticks=98523/100457, aggrin_queue=198595, aggrutil=99.74%
  sda: ios=862631/862871, merge=0/18, ticks=98523/100457, in_queue=198595, util=99.74%
速度在110m/s左右,看来磁盘还是挺不错的。
32k随机读写测试:
[root@380p1 ~]# fio -filename=/root/bench/test.fio  -direct=1 -rw=rw -bs=32k -size 1G -numjobs=8 -runtime=30 -group_reporting -name=file
file: (g=0): rw=rw, bs=(R) 32.0KiB-32.0KiB, (W) 32.0KiB-32.0KiB, (T) 32.0KiB-32.0KiB, ioengine=psync, iodepth=1
...
fio-3.6-31-g4386
Starting 8 processes
Jobs: 8 (f=8): [M(8)][100.0%][r=544MiB/s,w=544MiB/s][r=17.4k,w=17.4k IOPS][eta 00m:00s]
file: (groupid=0, jobs=8): err= 0: pid=31050: Sat May 12 17:33:28 2018
   read: IOPS=17.8k, BW=556MiB/s (583MB/s)(4094MiB/7359msec)
    clat (usec): min=86, max=10778, avg=215.04, stdev=118.55
     lat (usec): min=86, max=10779, avg=215.34, stdev=118.55
    clat percentiles (usec):
     |  1.00th=[  127],  5.00th=[  147], 10.00th=[  161], 20.00th=[  172],
     | 30.00th=[  180], 40.00th=[  186], 50.00th=[  192], 60.00th=[  200],
     | 70.00th=[  210], 80.00th=[  227], 90.00th=[  258], 95.00th=[  306],
     | 99.00th=[  758], 99.50th=[  816], 99.90th=[ 1205], 99.95th=[ 1549],
     | 99.99th=[ 3359]
   bw (  KiB/s): min=58688, max=78336, per=12.79%, avg=72894.37, stdev=3584.25, samples=112
   iops        : min= 1834, max= 2448, avg=2277.93, stdev=112.01, samples=112
  write: IOPS=17.8k, BW=557MiB/s (584MB/s)(4098MiB/7359msec)
    clat (usec): min=90, max=37591, avg=216.08, stdev=252.81
     lat (usec): min=92, max=37593, avg=217.75, stdev=252.81
    clat percentiles (usec):
     |  1.00th=[  133],  5.00th=[  151], 10.00th=[  161], 20.00th=[  172],
     | 30.00th=[  180], 40.00th=[  186], 50.00th=[  192], 60.00th=[  198],
     | 70.00th=[  208], 80.00th=[  225], 90.00th=[  258], 95.00th=[  306],
     | 99.00th=[  758], 99.50th=[  816], 99.90th=[ 1237], 99.95th=[ 1598],
     | 99.99th=[ 3720]
   bw (  KiB/s): min=61184, max=78656, per=12.78%, avg=72869.89, stdev=3722.37, samples=112
   iops        : min= 1912, max= 2458, avg=2277.16, stdev=116.33, samples=112
  lat (usec)   : 100=0.02%, 250=88.66%, 500=8.21%, 750=2.03%, 1000=0.93%
  lat (msec)   : 2=0.12%, 4=0.03%, 10=0.01%, 20=0.01%, 50=0.01%
  cpu          : usr=2.29%, sys=14.10%, ctx=267847, majf=0, minf=410
  IO depths    : 1=100.0%, 2=0.0%, 4=0.0%, 8=0.0%, 16=0.0%, 32=0.0%, >=64=0.0%
     submit    : 0=0.0%, 4=100.0%, 8=0.0%, 16=0.0%, 32=0.0%, 64=0.0%, >=64=0.0%
     complete  : 0=0.0%, 4=100.0%, 8=0.0%, 16=0.0%, 32=0.0%, 64=0.0%, >=64=0.0%
     issued rwts: total=131019,131125,0,0 short=0,0,0,0 dropped=0,0,0,0
     latency   : target=0, window=0, percentile=100.00%, depth=1

Run status group 0 (all jobs):
   READ: bw=556MiB/s (583MB/s), 556MiB/s-556MiB/s (583MB/s-583MB/s), io=4094MiB (4293MB), run=7359-7359msec
  WRITE: bw=557MiB/s (584MB/s), 557MiB/s-557MiB/s (584MB/s-584MB/s), io=4098MiB (4297MB), run=7359-7359msec

Disk stats (read/write):
    dm-1: ios=129689/129818, merge=0/0, ticks=25758/25617, in_queue=54558, util=99.86%, aggrios=131019/131125, aggrmerge=0/0, aggrticks=25912/25727, aggrin_queue=51521, aggrutil=98.27%
  sda: ios=131019/131125, merge=0/0, ticks=25912/25727, in_queue=51521, util=98.27%
我想这个速度应该是被缓存卡缓存了,在580m/s左右。
1m随机读写测试:
[root@380p1 ~]# fio -filename=/root/bench/test.fio  -direct=1 -rw=rw -bs=1m -size 1G -numjobs=8 -runtime=30 -group_reporting -name=file
file: (g=0): rw=rw, bs=(R) 1024KiB-1024KiB, (W) 1024KiB-1024KiB, (T) 1024KiB-1024KiB, ioengine=psync, iodepth=1
...
fio-3.6-31-g4386
Starting 8 processes
Jobs: 5 (f=5): [M(1),_(1),M(4),_(2)][100.0%][r=444MiB/s,w=477MiB/s][r=444,w=477 IOPS][eta 00m:00s]
file: (groupid=0, jobs=8): err= 0: pid=31076: Sat May 12 17:34:34 2018
   read: IOPS=334, BW=334MiB/s (351MB/s)(4012MiB/12000msec)
    clat (usec): min=1019, max=1587.4k, avg=14413.94, stdev=64657.06
     lat (usec): min=1019, max=1587.4k, avg=14414.43, stdev=64657.06
    clat percentiles (usec):
     |  1.00th=[   1532],  5.00th=[   2409], 10.00th=[   3195],
     | 20.00th=[   3851], 30.00th=[   4359], 40.00th=[   4686],
     | 50.00th=[   5014], 60.00th=[   5342], 70.00th=[   5735],
     | 80.00th=[   6325], 90.00th=[   7898], 95.00th=[  45351],
     | 99.00th=[ 210764], 99.50th=[ 392168], 99.90th=[1249903],
     | 99.95th=[1249903], 99.99th=[1585447]
   bw (  KiB/s): min= 2043, max=100151, per=13.03%, avg=44609.24, stdev=23766.26, samples=174
   iops        : min=    1, max=   97, avg=43.47, stdev=23.19, samples=174
  write: IOPS=348, BW=348MiB/s (365MB/s)(4180MiB/12000msec)
    clat (usec): min=1160, max=1255.9k, avg=8809.32, stdev=41022.78
     lat (usec): min=1211, max=1255.0k, avg=8865.73, stdev=41022.29
    clat percentiles (usec):
     |  1.00th=[   1434],  5.00th=[   2278], 10.00th=[   2737],
     | 20.00th=[   3326], 30.00th=[   3720], 40.00th=[   4047],
     | 50.00th=[   4359], 60.00th=[   4686], 70.00th=[   5014],
     | 80.00th=[   5407], 90.00th=[   6063], 95.00th=[   8586],
     | 99.00th=[ 112722], 99.50th=[ 179307], 99.90th=[ 517997],
     | 99.95th=[1115685], 99.99th=[1249903]
   bw (  KiB/s): min= 2043, max=108544, per=13.19%, avg=47057.34, stdev=25265.67, samples=172
   iops        : min=    1, max=  106, avg=45.86, stdev=24.66, samples=172
  lat (msec)   : 2=2.66%, 4=28.05%, 10=63.48%, 20=1.33%, 50=0.62%
  lat (msec)   : 100=1.67%, 250=1.70%, 500=0.27%, 750=0.12%
  cpu          : usr=0.32%, sys=1.06%, ctx=9070, majf=0, minf=273
  IO depths    : 1=100.0%, 2=0.0%, 4=0.0%, 8=0.0%, 16=0.0%, 32=0.0%, >=64=0.0%
     submit    : 0=0.0%, 4=100.0%, 8=0.0%, 16=0.0%, 32=0.0%, 64=0.0%, >=64=0.0%
     complete  : 0=0.0%, 4=100.0%, 8=0.0%, 16=0.0%, 32=0.0%, 64=0.0%, >=64=0.0%
     issued rwts: total=4012,4180,0,0 short=0,0,0,0 dropped=0,0,0,0
     latency   : target=0, window=0, percentile=100.00%, depth=1

Run status group 0 (all jobs):
   READ: bw=334MiB/s (351MB/s), 334MiB/s-334MiB/s (351MB/s-351MB/s), io=4012MiB (4207MB), run=12000-12000msec
  WRITE: bw=348MiB/s (365MB/s), 348MiB/s-348MiB/s (365MB/s-365MB/s), io=4180MiB (4383MB), run=12000-12000msec

Disk stats (read/write):
    dm-1: ios=7908/8272, merge=0/0, ticks=114032/72671, in_queue=188677, util=99.26%, aggrios=8024/8360, aggrmerge=0/0, aggrticks=114610/73023, aggrin_queue=187594, aggrutil=99.04%
  sda: ios=8024/8360, merge=0/0, ticks=114610/73023, in_queue=187594, util=99.04%
这个速度也很高,在350m/s左右。
0x03.2 RAID 10的环境中测试磁盘性能
[root@380G6 ~]# dd bs=1M count=1024 if=/dev/zero of=1gb-1.test conv=fdatasync
1024+0 records in
1024+0 records out
1073741824 bytes (1.1 GB) copied, 4.7334 s, 227 MB/s

[root@380G6 ~]# dd bs=1M count=1024 if=/dev/zero of=1gb-2.test conv=fdatasync
1024+0 records in
1024+0 records out
1073741824 bytes (1.1 GB) copied, 4.78248 s, 225 MB/s

[root@380G6 ~]# dd bs=1M count=1024 if=/dev/zero of=1gb-3.test conv=fdatasync
1024+0 records in
1024+0 records out
1073741824 bytes (1.1 GB) copied, 4.66221 s, 230 MB/s

[root@380G6 ~]# dd bs=1M count=1024 if=/dev/zero of=1gb-4.test conv=fdatasync
1024+0 records in
1024+0 records out
1073741824 bytes (1.1 GB) copied, 4.6648 s, 230 MB/s

[root@380G6 ~]# dd bs=1M count=1024 if=/dev/zero of=1gb-5.test conv=fdatasync
1024+0 records in
1024+0 records out
1073741824 bytes (1.1 GB) copied, 4.64573 s, 231 MB/s
RAID 10的结果比RAID 5的280m/s略胜一筹。
4k随机读写测试:
[root@380G6 ~]# fio -filename=/root/bench/test.fio  -direct=1 -rw=rw -bs=4k -size 1G -numjobs=8 -runtime=30 -group_reporting -name=file
file: (g=0): rw=rw, bs=(R) 4096B-4096B, (W) 4096B-4096B, (T) 4096B-4096B, ioengine=psync, iodepth=1
...
fio-3.6-31-g4386
Starting 8 processes
file: Laying out IO file (1 file / 1024MiB)
Jobs: 8 (f=8): [M(8)][100.0%][r=101MiB/s,w=101MiB/s][r=25.9k,w=25.9k IOPS][eta 00m:00s]
file: (groupid=0, jobs=8): err= 0: pid=31269: Sat May 12 19:46:43 2018
   read: IOPS=25.0k, BW=97.7MiB/s (102MB/s)(2931MiB/30001msec)
    clat (usec): min=52, max=133121, avg=154.73, stdev=214.23
     lat (usec): min=52, max=133122, avg=155.08, stdev=214.24
    clat percentiles (usec):
     |  1.00th=[   76],  5.00th=[   91], 10.00th=[  100], 20.00th=[  113],
     | 30.00th=[  124], 40.00th=[  133], 50.00th=[  141], 60.00th=[  151],
     | 70.00th=[  163], 80.00th=[  180], 90.00th=[  210], 95.00th=[  243],
     | 99.00th=[  578], 99.50th=[  619], 99.90th=[  685], 99.95th=[  717],
     | 99.99th=[  791]
   bw (  KiB/s): min= 9568, max=15784, per=12.48%, avg=12479.38, stdev=1116.74, samples=472
   iops        : min= 2392, max= 3946, avg=3119.81, stdev=279.17, samples=472
  write: IOPS=25.0k, BW=97.7MiB/s (102MB/s)(2931MiB/30001msec)
    clat (usec): min=52, max=90265, avg=158.94, stdev=153.77
     lat (usec): min=52, max=90265, avg=159.43, stdev=153.78
    clat percentiles (usec):
     |  1.00th=[   79],  5.00th=[   95], 10.00th=[  103], 20.00th=[  117],
     | 30.00th=[  128], 40.00th=[  137], 50.00th=[  145], 60.00th=[  155],
     | 70.00th=[  167], 80.00th=[  184], 90.00th=[  215], 95.00th=[  249],
     | 99.00th=[  586], 99.50th=[  627], 99.90th=[  693], 99.95th=[  717],
     | 99.99th=[  775]
   bw (  KiB/s): min= 9424, max=16128, per=12.48%, avg=12478.56, stdev=1104.97, samples=472
   iops        : min= 2356, max= 4032, avg=3119.61, stdev=276.24, samples=472
  lat (usec)   : 100=8.84%, 250=86.54%, 500=3.05%, 750=1.55%, 1000=0.02%
  lat (msec)   : 2=0.01%, 4=0.01%, 10=0.01%, 20=0.01%, 50=0.01%
  lat (msec)   : 100=0.01%, 250=0.01%
  cpu          : usr=3.13%, sys=25.26%, ctx=1566610, majf=0, minf=895
  IO depths    : 1=100.0%, 2=0.0%, 4=0.0%, 8=0.0%, 16=0.0%, 32=0.0%, >=64=0.0%
     submit    : 0=0.0%, 4=100.0%, 8=0.0%, 16=0.0%, 32=0.0%, 64=0.0%, >=64=0.0%
     complete  : 0=0.0%, 4=100.0%, 8=0.0%, 16=0.0%, 32=0.0%, 64=0.0%, >=64=0.0%
     issued rwts: total=750249,750239,0,0 short=0,0,0,0 dropped=0,0,0,0
     latency   : target=0, window=0, percentile=100.00%, depth=1

Run status group 0 (all jobs):
   READ: bw=97.7MiB/s (102MB/s), 97.7MiB/s-97.7MiB/s (102MB/s-102MB/s), io=2931MiB (3073MB), run=30001-30001msec
  WRITE: bw=97.7MiB/s (102MB/s), 97.7MiB/s-97.7MiB/s (102MB/s-102MB/s), io=2931MiB (3073MB), run=30001-30001msec

Disk stats (read/write):
    dm-0: ios=745867/745800, merge=0/0, ticks=99928/101713, in_queue=222033, util=100.00%, aggrios=750249/750287, aggrmerge=0/19, aggrticks=100079/101811, aggrin_queue=201957, aggrutil=99.77%
  sda: ios=750249/750287, merge=0/19, ticks=100079/101811, in_queue=201957, util=99.77%
RAID 10的4K结果为100m/s左右,较RAID 5的110m/s少了一点。
32k随机读写测试:
[root@380G6 ~]# fio -filename=/root/bench/test.fio  -direct=1 -rw=rw -bs=32k -size 1G -numjobs=8 -runtime=30 -group_reporting -name=file
file: (g=0): rw=rw, bs=(R) 32.0KiB-32.0KiB, (W) 32.0KiB-32.0KiB, (T) 32.0KiB-32.0KiB, ioengine=psync, iodepth=1
...
fio-3.6-31-g4386
Starting 8 processes
Jobs: 8 (f=8): [M(8)][100.0%][r=559MiB/s,w=557MiB/s][r=17.9k,w=17.8k IOPS][eta 00m:00s]
file: (groupid=0, jobs=8): err= 0: pid=31295: Sat May 12 19:48:03 2018
   read: IOPS=17.7k, BW=553MiB/s (580MB/s)(4094MiB/7404msec)
    clat (usec): min=82, max=100901, avg=221.53, stdev=741.09
     lat (usec): min=82, max=100902, avg=221.87, stdev=741.09
    clat percentiles (usec):
     |  1.00th=[  119],  5.00th=[  145], 10.00th=[  161], 20.00th=[  176],
     | 30.00th=[  184], 40.00th=[  192], 50.00th=[  198], 60.00th=[  206],
     | 70.00th=[  217], 80.00th=[  231], 90.00th=[  262], 95.00th=[  310],
     | 99.00th=[  676], 99.50th=[  725], 99.90th=[  816], 99.95th=[  865],
     | 99.99th=[38536]
   bw (  KiB/s): min=47744, max=81920, per=12.67%, avg=71730.44, stdev=7011.10, samples=112
   iops        : min= 1492, max= 2560, avg=2241.56, stdev=219.10, samples=112
  write: IOPS=17.7k, BW=553MiB/s (580MB/s)(4098MiB/7404msec)
    clat (usec): min=87, max=104739, avg=216.55, stdev=563.24
     lat (usec): min=88, max=104740, avg=218.33, stdev=563.24
    clat percentiles (usec):
     |  1.00th=[  123],  5.00th=[  149], 10.00th=[  161], 20.00th=[  174],
     | 30.00th=[  184], 40.00th=[  190], 50.00th=[  198], 60.00th=[  204],
     | 70.00th=[  215], 80.00th=[  227], 90.00th=[  260], 95.00th=[  310],
     | 99.00th=[  676], 99.50th=[  717], 99.90th=[  807], 99.95th=[  840],
     | 99.99th=[  963]
   bw (  KiB/s): min=48448, max=82688, per=12.66%, avg=71724.04, stdev=7205.60, samples=112
   iops        : min= 1514, max= 2584, avg=2241.37, stdev=225.18, samples=112
  lat (usec)   : 100=0.27%, 250=87.72%, 500=9.76%, 750=1.96%, 1000=0.28%
  lat (msec)   : 2=0.01%, 4=0.01%, 10=0.01%, 20=0.01%, 50=0.01%
  lat (msec)   : 100=0.01%, 250=0.01%
  cpu          : usr=2.50%, sys=15.26%, ctx=268790, majf=0, minf=406
  IO depths    : 1=100.0%, 2=0.0%, 4=0.0%, 8=0.0%, 16=0.0%, 32=0.0%, >=64=0.0%
     submit    : 0=0.0%, 4=100.0%, 8=0.0%, 16=0.0%, 32=0.0%, 64=0.0%, >=64=0.0%
     complete  : 0=0.0%, 4=100.0%, 8=0.0%, 16=0.0%, 32=0.0%, 64=0.0%, >=64=0.0%
     issued rwts: total=131019,131125,0,0 short=0,0,0,0 dropped=0,0,0,0
     latency   : target=0, window=0, percentile=100.00%, depth=1

Run status group 0 (all jobs):
   READ: bw=553MiB/s (580MB/s), 553MiB/s-553MiB/s (580MB/s-580MB/s), io=4094MiB (4293MB), run=7404-7404msec
  WRITE: bw=553MiB/s (580MB/s), 553MiB/s-553MiB/s (580MB/s-580MB/s), io=4098MiB (4297MB), run=7404-7404msec

Disk stats (read/write):
    dm-0: ios=130961/131067, merge=0/0, ticks=26466/25721, in_queue=56508, util=100.00%, aggrios=131019/131125, aggrmerge=0/0, aggrticks=26409/25691, aggrin_queue=52085, aggrutil=98.46%
  sda: ios=131019/131125, merge=0/0, ticks=26409/25691, in_queue=52085, util=98.46%
RAID 10的32K随机读写速度与RAID 5的相差不多。
1m随机读写测试:
[root@380G6 ~]# fio -filename=/root/bench/test.fio  -direct=1 -rw=rw -bs=1m -size 1G -numjobs=8 -runtime=30 -group_reporting -name=file
file: (g=0): rw=rw, bs=(R) 1024KiB-1024KiB, (W) 1024KiB-1024KiB, (T) 1024KiB-1024KiB, ioengine=psync, iodepth=1
...
fio-3.6-31-g4386
Starting 8 processes
Jobs: 5 (f=5): [M(2),_(1),M(2),_(1),M(1),_(1)][92.3%][r=435MiB/s,w=469MiB/s][r=435,w=469 IOPS][eta 00m:01s]
file: (groupid=0, jobs=8): err= 0: pid=31322: Sat May 12 19:49:10 2018
   read: IOPS=330, BW=330MiB/s (346MB/s)(4012MiB/12156msec)
    clat (usec): min=854, max=373553, avg=13982.25, stdev=34835.55
     lat (usec): min=855, max=373554, avg=13982.74, stdev=34835.54
    clat percentiles (msec):
     |  1.00th=[    3],  5.00th=[    4], 10.00th=[    5], 20.00th=[    5],
     | 30.00th=[    6], 40.00th=[    6], 50.00th=[    6], 60.00th=[    7],
     | 70.00th=[    7], 80.00th=[    7], 90.00th=[    8], 95.00th=[   65],
     | 99.00th=[  203], 99.50th=[  230], 99.90th=[  313], 99.95th=[  355],
     | 99.99th=[  376]
   bw (  KiB/s): min=10240, max=83968, per=12.29%, avg=41531.97, stdev=16267.37, samples=186
   iops        : min=   10, max=   82, avg=40.46, stdev=15.87, samples=186
  write: IOPS=343, BW=344MiB/s (361MB/s)(4180MiB/12156msec)
    clat (usec): min=894, max=356092, avg=9500.70, stdev=24636.85
     lat (usec): min=918, max=356152, avg=9556.35, stdev=24637.04
    clat percentiles (msec):
     |  1.00th=[    3],  5.00th=[    4], 10.00th=[    5], 20.00th=[    5],
     | 30.00th=[    6], 40.00th=[    6], 50.00th=[    6], 60.00th=[    7],
     | 70.00th=[    7], 80.00th=[    7], 90.00th=[    8], 95.00th=[    8],
     | 99.00th=[  153], 99.50th=[  197], 99.90th=[  305], 99.95th=[  355],
     | 99.99th=[  355]
   bw (  KiB/s): min= 6144, max=107536, per=12.31%, avg=43361.76, stdev=18967.14, samples=186
   iops        : min=    6, max=  105, avg=42.25, stdev=18.50, samples=186
  lat (usec)   : 1000=0.09%
  lat (msec)   : 2=0.48%, 4=5.11%, 10=88.23%, 20=0.45%, 50=1.11%
  lat (msec)   : 100=2.10%, 250=2.21%, 500=0.22%
  cpu          : usr=0.34%, sys=0.97%, ctx=8968, majf=0, minf=270
  IO depths    : 1=100.0%, 2=0.0%, 4=0.0%, 8=0.0%, 16=0.0%, 32=0.0%, >=64=0.0%
     submit    : 0=0.0%, 4=100.0%, 8=0.0%, 16=0.0%, 32=0.0%, 64=0.0%, >=64=0.0%
     complete  : 0=0.0%, 4=100.0%, 8=0.0%, 16=0.0%, 32=0.0%, 64=0.0%, >=64=0.0%
     issued rwts: total=4012,4180,0,0 short=0,0,0,0 dropped=0,0,0,0
     latency   : target=0, window=0, percentile=100.00%, depth=1

Run status group 0 (all jobs):
   READ: bw=330MiB/s (346MB/s), 330MiB/s-330MiB/s (346MB/s-346MB/s), io=4012MiB (4207MB), run=12156-12156msec
  WRITE: bw=344MiB/s (361MB/s), 344MiB/s-344MiB/s (361MB/s-361MB/s), io=4180MiB (4383MB), run=12156-12156msec

Disk stats (read/write):
    dm-0: ios=7998/8337, merge=0/0, ticks=111399/78702, in_queue=190413, util=99.36%, aggrios=8024/8361, aggrmerge=0/0, aggrticks=111418/78705, aggrin_queue=190096, aggrutil=99.05%
  sda: ios=8024/8361, merge=0/0, ticks=111418/78705, in_queue=190096, util=99.05%
RAID 10的1m随机读写速度与RAID 5的相差不多。
0x03.3 禁用Power Capping时的整体性能
------------------------------------------------------------------------
Benchmark Run: Sat May 12 2018 21:30:31 - 21:58:36
16 CPUs in system; running 1 parallel copy of tests

Dhrystone 2 using register variables       23806589.8 lps   (10.0 s, 7 samples)
Double-Precision Whetstone                     3143.5 MWIPS (9.3 s, 7 samples)
Execl Throughput                               1592.1 lps   (29.6 s, 2 samples)
File Copy 1024 bufsize 2000 maxblocks        477843.9 KBps  (30.0 s, 2 samples)
File Copy 256 bufsize 500 maxblocks          126115.2 KBps  (30.0 s, 2 samples)
File Copy 4096 bufsize 8000 maxblocks       1257179.0 KBps  (30.0 s, 2 samples)
Pipe Throughput                              589279.2 lps   (10.0 s, 7 samples)
Pipe-based Context Switching                 108094.4 lps   (10.0 s, 7 samples)
Process Creation                               3551.7 lps   (30.0 s, 2 samples)
Shell Scripts (1 concurrent)                   3369.7 lpm   (60.0 s, 2 samples)
Shell Scripts (8 concurrent)                   2086.9 lpm   (60.0 s, 2 samples)
System Call Overhead                         557238.8 lps   (10.0 s, 7 samples)

System Benchmarks Index Values               BASELINE       RESULT    INDEX
Dhrystone 2 using register variables         116700.0   23806589.8   2040.0
Double-Precision Whetstone                       55.0       3143.5    571.5
Execl Throughput                                 43.0       1592.1    370.3
File Copy 1024 bufsize 2000 maxblocks          3960.0     477843.9   1206.7
File Copy 256 bufsize 500 maxblocks            1655.0     126115.2    762.0
File Copy 4096 bufsize 8000 maxblocks          5800.0    1257179.0   2167.5
Pipe Throughput                               12440.0     589279.2    473.7
Pipe-based Context Switching                   4000.0     108094.4    270.2
Process Creation                                126.0       3551.7    281.9
Shell Scripts (1 concurrent)                     42.4       3369.7    794.7
Shell Scripts (8 concurrent)                      6.0       2086.9   3478.1
System Call Overhead                          15000.0     557238.8    371.5
                                                                   ========
System Benchmarks Index Score                                         750.4

------------------------------------------------------------------------
Benchmark Run: Sat May 12 2018 21:58:36 - 22:26:25
16 CPUs in system; running 16 parallel copies of tests

Dhrystone 2 using register variables      190796296.4 lps   (10.0 s, 7 samples)
Double-Precision Whetstone                    38221.2 MWIPS (9.7 s, 7 samples)
Execl Throughput                              22683.0 lps   (30.0 s, 2 samples)
File Copy 1024 bufsize 2000 maxblocks        662626.5 KBps  (30.0 s, 2 samples)
File Copy 256 bufsize 500 maxblocks          187366.5 KBps  (30.0 s, 2 samples)
File Copy 4096 bufsize 8000 maxblocks       1944384.0 KBps  (30.0 s, 2 samples)
Pipe Throughput                             6164645.5 lps   (10.0 s, 7 samples)
Pipe-based Context Switching                1386729.5 lps   (10.0 s, 7 samples)
Process Creation                              59669.5 lps   (30.0 s, 2 samples)
Shell Scripts (1 concurrent)                  36711.1 lpm   (60.0 s, 2 samples)
Shell Scripts (8 concurrent)                   4942.1 lpm   (60.1 s, 2 samples)
System Call Overhead                        4534713.2 lps   (10.0 s, 7 samples)

System Benchmarks Index Values               BASELINE       RESULT    INDEX
Dhrystone 2 using register variables         116700.0  190796296.4  16349.3
Double-Precision Whetstone                       55.0      38221.2   6949.3
Execl Throughput                                 43.0      22683.0   5275.1
File Copy 1024 bufsize 2000 maxblocks          3960.0     662626.5   1673.3
File Copy 256 bufsize 500 maxblocks            1655.0     187366.5   1132.1
File Copy 4096 bufsize 8000 maxblocks          5800.0    1944384.0   3352.4
Pipe Throughput                               12440.0    6164645.5   4955.5
Pipe-based Context Switching                   4000.0    1386729.5   3466.8
Process Creation                                126.0      59669.5   4735.7
Shell Scripts (1 concurrent)                     42.4      36711.1   8658.3
Shell Scripts (8 concurrent)                      6.0       4942.1   8236.9
System Call Overhead                          15000.0    4534713.2   3023.1
                                                                   ========
System Benchmarks Index Score                                        4487.9
0x03.4 Power Capping为50%时的整体性能

上图为设置示意图,下方为结果:
------------------------------------------------------------------------
Benchmark Run: Sat May 12 2018 22:29:30 - 22:57:35
16 CPUs in system; running 1 parallel copy of tests

Dhrystone 2 using register variables       23745288.4 lps   (10.0 s, 7 samples)
Double-Precision Whetstone                     3143.5 MWIPS (9.3 s, 7 samples)
Execl Throughput                               1628.4 lps   (29.7 s, 2 samples)
File Copy 1024 bufsize 2000 maxblocks        461504.0 KBps  (30.0 s, 2 samples)
File Copy 256 bufsize 500 maxblocks          124107.0 KBps  (30.0 s, 2 samples)
File Copy 4096 bufsize 8000 maxblocks       1227233.2 KBps  (30.0 s, 2 samples)
Pipe Throughput                              585536.5 lps   (10.0 s, 7 samples)
Pipe-based Context Switching                 108645.4 lps   (10.0 s, 7 samples)
Process Creation                               3529.8 lps   (30.0 s, 2 samples)
Shell Scripts (1 concurrent)                   3356.0 lpm   (60.0 s, 2 samples)
Shell Scripts (8 concurrent)                   2073.6 lpm   (60.0 s, 2 samples)
System Call Overhead                         526798.7 lps   (10.0 s, 7 samples)

System Benchmarks Index Values               BASELINE       RESULT    INDEX
Dhrystone 2 using register variables         116700.0   23745288.4   2034.7
Double-Precision Whetstone                       55.0       3143.5    571.5
Execl Throughput                                 43.0       1628.4    378.7
File Copy 1024 bufsize 2000 maxblocks          3960.0     461504.0   1165.4
File Copy 256 bufsize 500 maxblocks            1655.0     124107.0    749.9
File Copy 4096 bufsize 8000 maxblocks          5800.0    1227233.2   2115.9
Pipe Throughput                               12440.0     585536.5    470.7
Pipe-based Context Switching                   4000.0     108645.4    271.6
Process Creation                                126.0       3529.8    280.1
Shell Scripts (1 concurrent)                     42.4       3356.0    791.5
Shell Scripts (8 concurrent)                      6.0       2073.6   3456.0
System Call Overhead                          15000.0     526798.7    351.2
                                                                   ========
System Benchmarks Index Score                                         742.4

------------------------------------------------------------------------
Benchmark Run: Sat May 12 2018 22:57:35 - 23:25:53
16 CPUs in system; running 16 parallel copies of tests

Dhrystone 2 using register variables      116011916.0 lps   (10.0 s, 7 samples)
Double-Precision Whetstone                    26322.8 MWIPS (11.2 s, 7 samples)
Execl Throughput                              13840.6 lps   (29.9 s, 2 samples)
File Copy 1024 bufsize 2000 maxblocks        413571.7 KBps  (30.0 s, 2 samples)
File Copy 256 bufsize 500 maxblocks          113527.7 KBps  (30.0 s, 2 samples)
File Copy 4096 bufsize 8000 maxblocks       1172075.9 KBps  (30.0 s, 2 samples)
Pipe Throughput                             4056963.1 lps   (10.0 s, 7 samples)
Pipe-based Context Switching                 948133.5 lps   (10.0 s, 7 samples)
Process Creation                              31880.5 lps   (30.0 s, 2 samples)
Shell Scripts (1 concurrent)                  19067.8 lpm   (60.0 s, 2 samples)
Shell Scripts (8 concurrent)                   2410.4 lpm   (60.2 s, 2 samples)
System Call Overhead                        3354733.9 lps   (10.0 s, 7 samples)

System Benchmarks Index Values               BASELINE       RESULT    INDEX
Dhrystone 2 using register variables         116700.0  116011916.0   9941.0
Double-Precision Whetstone                       55.0      26322.8   4786.0
Execl Throughput                                 43.0      13840.6   3218.7
File Copy 1024 bufsize 2000 maxblocks          3960.0     413571.7   1044.4
File Copy 256 bufsize 500 maxblocks            1655.0     113527.7    686.0
File Copy 4096 bufsize 8000 maxblocks          5800.0    1172075.9   2020.8
Pipe Throughput                               12440.0    4056963.1   3261.2
Pipe-based Context Switching                   4000.0     948133.5   2370.3
Process Creation                                126.0      31880.5   2530.2
Shell Scripts (1 concurrent)                     42.4      19067.8   4497.1
Shell Scripts (8 concurrent)                      6.0       2410.4   4017.4
System Call Overhead                          15000.0    3354733.9   2236.5
                                                                   ========
System Benchmarks Index Score                                        2735.0
单线程的评分没差别,但是多线程的评分腰斩了,只有2735.0。
从下面的图片可以看到,设定了Power Capping之后确实可以很好地控制功率,但是性能也随之下降。在实际使用过程中可以根据情况进行调控:

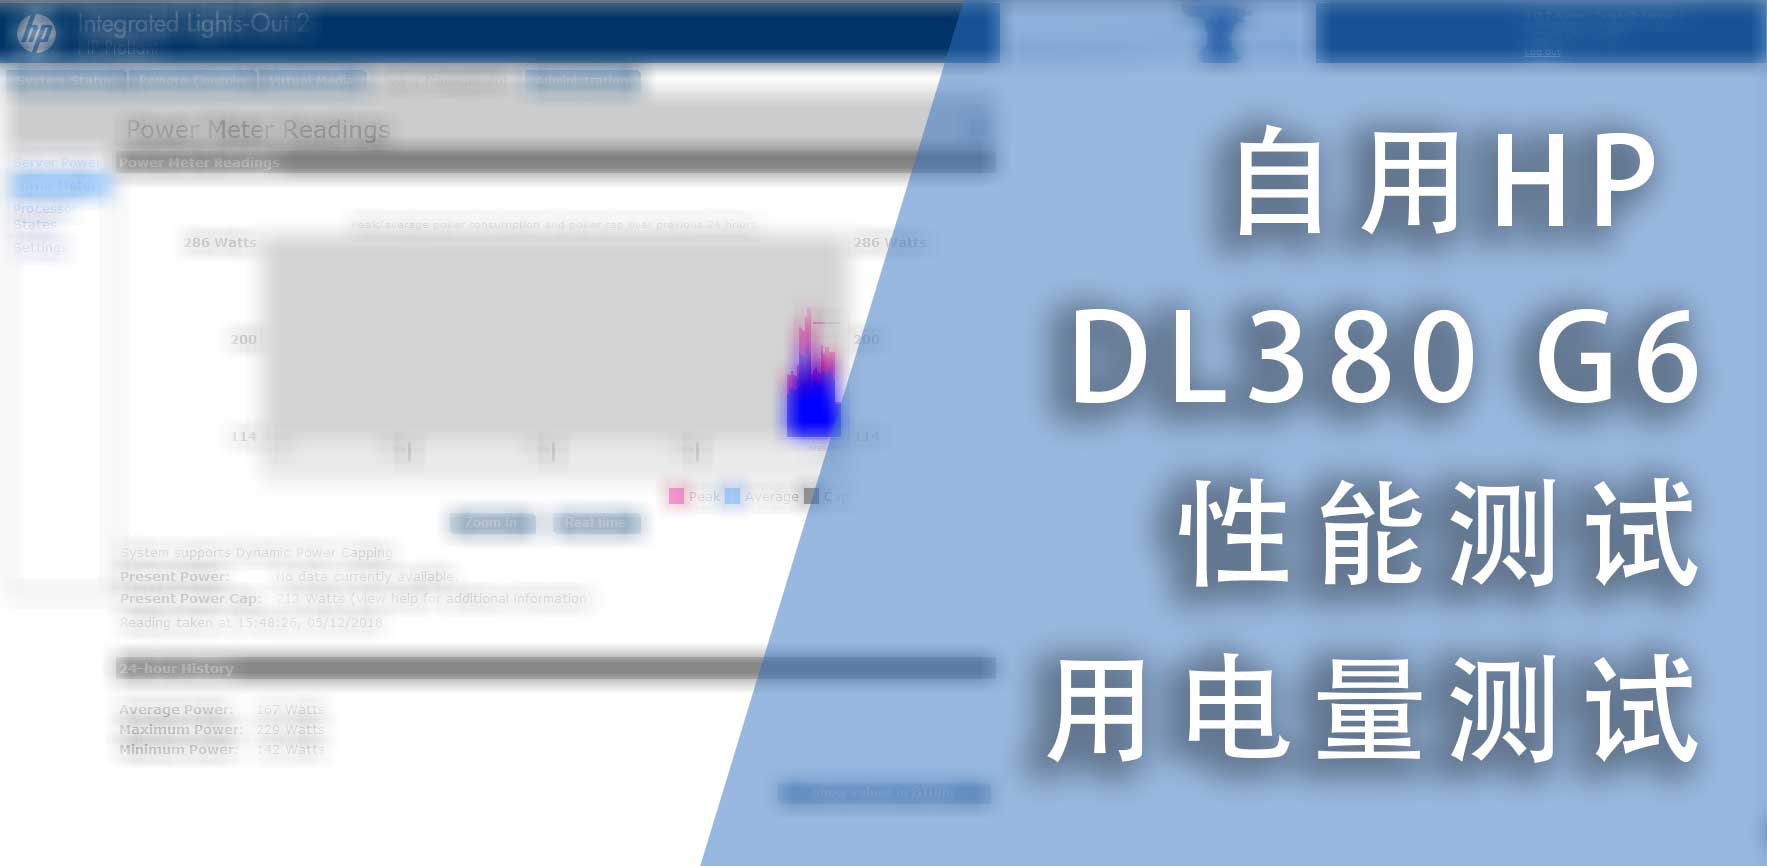
经过监测,得出以下功率数值:
- 0负载的功耗为:150W左右
- 100%负载时的功耗为270W左右
0x04 结语
因为我的硬盘和内存都没有满配,同时CPU也是低电压的版本,所以这个功耗值并不代表其他配置的情况。


