0x01 前言
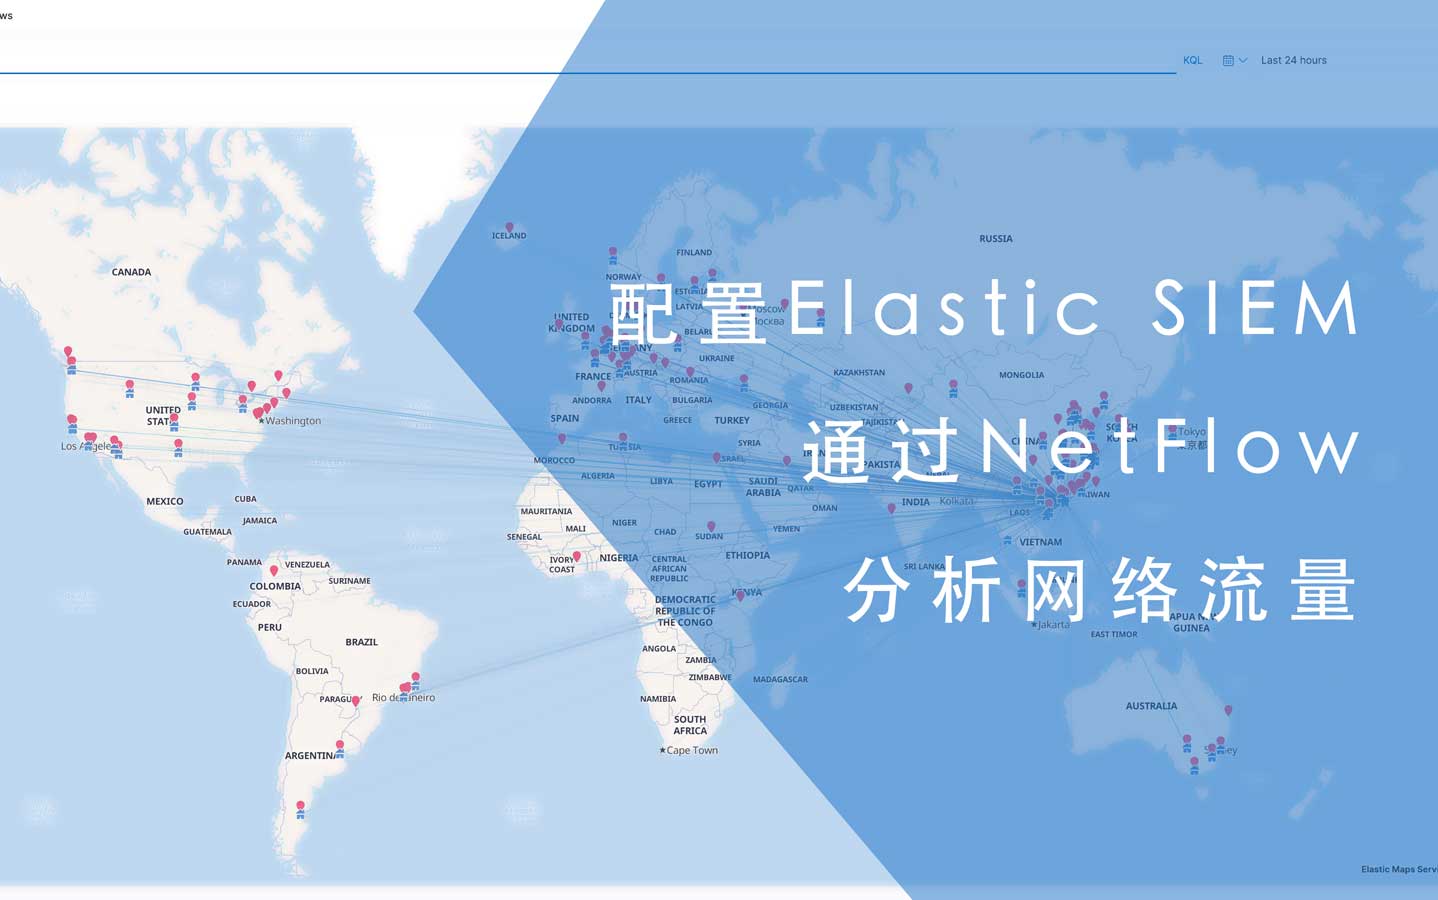
我喜欢使用NetFlow和sFlow对一些网络设备的流量进行采样分析和监控,以前常用ManageEngine NetFlow Analyzer,过去一段时间使用VMware vRealize Network Insight。
但很不幸,他们都是商业软件,在使用上要考量很多因素,所以我决定转而使用发展神速的Elastic套件。
0x02 准备
在继续之前需要了解NetFlow是什么,它来自思科,可以在思科的网络设备中见到它,诸如H3C或华为等产品则是sFlow。笼统来说,他们的功能是一样的:都是在设定的时间间隔对网络流量进行取样并发送至收集器。
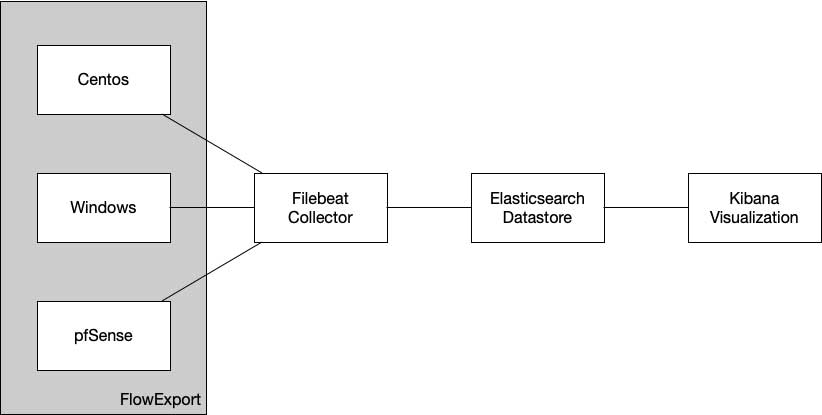
在这篇文章里的收集器由filebeat实现,然后输出至elasticsearch,最终交由kibana呈现可视化界面和实现告警等功能。而数据则来自测试的虚拟机,分别有一台Windows和一台centos,另外还有我的pfsense,大致架构如下:
其中一些组件的安装配置在本文不再赘述,有需要的朋友可以自行搜索本站。Exporter我使用flowtraq的二进制安装包,可以尝试使用以下地址下载:
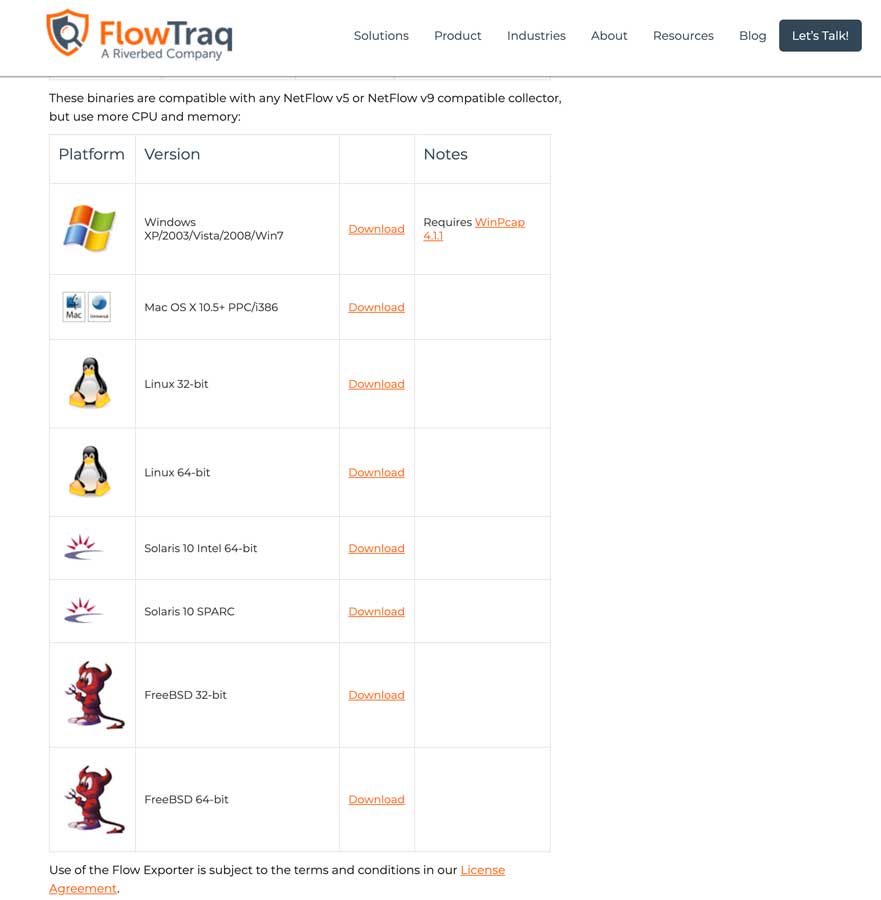
正如上图中所描述的,这需要消耗一些CPU和内存资源,而且只支持NetFlow v5和v9的Collector,这一般来说是没问题的,还需要注意页面底部的License Agreement,必要的时候可以使用softflowd作为exporter。
另外,Windows操作系统还需要安装winpcap:
最重要的,需要有一个elasticsearch集群或一个实例,一个kibana实例,并且它们都工作正常。另外需要准备一台虚拟机用于安装各种beat,当然,我们也可以使用docker,相关文档地址如下:
0x03 部署
0x03.1 filebeat
部署及其简单,连配置文件都不需要,只需要准备elasticsearch地址和kibana地址即可,如果开启了x-pack的认证功能,还需要准备这些信息。以下是相关文档:
- module: netflow
  log:
    enabled: true
    var:
      netflow_host: 0.0.0.0
      netflow_port: 2055
配置文件也是简单得不得了,只是启用netflow模块,然后配置监听的IP和端口。还有一些配置项需要根据实际情况进行调整,具体可参考上述的链接。使用以下命令即可完成filebeat的安装:
[root@filebeat-netflow ~]# yum install filebeat -y
然后来到以下文件夹,可以发现内置的诸多模块:
# 进入模块配置文件目录
[root@filebeat-netflow ~]# cd /etc/filebeat/modules.d/

# 列出所有配置文件
[root@filebeat-netflow modules.d]# ll -h
总用量 160K
-rw-r--r-- 1 root root  483 5月  12 08:53 activemq.yml.disabled
-rw-r--r-- 1 root root  475 5月  12 08:53 apache.yml.disabled
-rw-r--r-- 1 root root  280 5月  12 08:53 auditd.yml.disabled
-rw-r--r-- 1 root root 6.2K 5月  12 08:53 aws.yml.disabled
-rw-r--r-- 1 root root 1.4K 5月  12 08:53 azure.yml.disabled
-rw-r--r-- 1 root root  200 5月  12 08:53 cef.yml.disabled
-rw-r--r-- 1 root root 2.0K 5月  12 08:53 cisco.yml.disabled
-rw-r--r-- 1 root root  318 5月  12 08:53 coredns.yml.disabled
-rw-r--r-- 1 root root  964 5月  12 08:53 elasticsearch.yml.disabled
-rw-r--r-- 1 root root  327 5月  12 08:53 envoyproxy.yml.disabled
-rw-r--r-- 1 root root 2.0K 5月  12 08:53 googlecloud.yml.disabled
-rw-r--r-- 1 root root  376 5月  12 08:53 haproxy.yml.disabled
-rw-r--r-- 1 root root  295 5月  12 08:53 ibmmq.yml.disabled
-rw-r--r-- 1 root root  651 5月  12 08:53 icinga.yml.disabled
-rw-r--r-- 1 root root  470 5月  12 08:53 iis.yml.disabled
-rw-r--r-- 1 root root  366 5月  12 08:53 iptables.yml.disabled
-rw-r--r-- 1 root root  398 5月  12 08:53 kafka.yml.disabled
-rw-r--r-- 1 root root  293 5月  12 08:53 kibana.yml.disabled
-rw-r--r-- 1 root root  471 5月  12 08:53 logstash.yml.disabled
-rw-r--r-- 1 root root  422 5月  12 08:53 misp.yml.disabled
-rw-r--r-- 1 root root  296 5月  12 08:53 mongodb.yml.disabled
-rw-r--r-- 1 root root  311 5月  12 08:53 mssql.yml.disabled
-rw-r--r-- 1 root root  471 5月  12 08:53 mysql.yml.disabled
-rw-r--r-- 1 root root  287 5月  12 08:53 nats.yml.disabled
-rw-r--r-- 1 root root  212 5月  17 14:07 netflow.yml
-rw-r--r-- 1 root root  214 5月  12 08:53 netflow.yml.disabled
-rw-r--r-- 1 root root  783 5月  12 08:53 nginx.yml.disabled
-rw-r--r-- 1 root root 1.5K 5月  12 08:53 o365.yml.disabled
-rw-r--r-- 1 root root  340 5月  12 08:53 okta.yml.disabled
-rw-r--r-- 1 root root  495 5月  12 08:53 osquery.yml.disabled
-rw-r--r-- 1 root root  356 5月  12 08:53 panw.yml.disabled
-rw-r--r-- 1 root root  305 5月  12 08:53 postgresql.yml.disabled
-rw-r--r-- 1 root root  343 5月  12 08:53 rabbitmq.yml.disabled
-rw-r--r-- 1 root root  566 5月  12 08:53 redis.yml.disabled
-rw-r--r-- 1 root root  266 5月  12 08:53 santa.yml.disabled
-rw-r--r-- 1 root root  299 5月  12 08:53 suricata.yml.disabled
-rw-r--r-- 1 root root  477 5月  12 08:53 system.yml.disabled
-rw-r--r-- 1 root root  302 5月  12 08:53 traefik.yml.disabled
-rw-r--r-- 1 root root 1.3K 5月  12 08:53 zeek.yml.disabled
如果需要启用某个模块,只需要将”.disable”后缀移除即可,比如:netflow.yml,而这个文件的内容正如本章开头那样,无需任何修改。
紧接着回到上一级目录,编辑filebeat.yml:
#============================== Kibana =====================================

# Starting with Beats version 6.0.0, the dashboards are loaded via the Kibana API.
# This requires a Kibana endpoint configuration.
setup.kibana:

  # Kibana Host
  # Scheme and port can be left out and will be set to the default (http and 5601)
  # In case you specify and additional path, the scheme is required: http://localhost:5601/path
  # IPv6 addresses should always be defined as: https://[2001:db8::1]:5601
  host: "kibana.dev.enginx.net:443"
  protocol: "https"

  # Kibana Space ID
  # ID of the Kibana Space into which the dashboards should be loaded. By default,
  # the Default Space will be used.
  #space.id:

#================================ Outputs =====================================

# Configure what output to use when sending the data collected by the beat.

#-------------------------- Elasticsearch output ------------------------------
output.elasticsearch:
  # Array of hosts to connect to.
  hosts: ["es6-node1.t.com:9200", "es6-node2.t.com:9200", "es6-node3.t.com:9200"]

  # Protocol - either `http` (default) or `https`.
  #protocol: "https"

  # Authentication credentials - either API key or username/password.
  #api_key: "id:api_key"
  #username: "elastic"
  #password: "changeme"
请根据实际情况修改以上代码中高亮的部分,最后启动filebeat即可:
systemctl enable filebeat && systemctl restart filebeat.service
如果一切正常,那么可以发现filebeat正监听着UDP 2055端口:
[root@filebeat-netflow filebeat]# netstat -anp | grep 2055
udp6       0       0 :::2055       :::*       13116/filebeat
0x03.2 kibana
filebeat其实内置着一些dashboard配置,如果想偷懒,可以导入预设的配置。在这里也建议使用预设的配置,可以以此为基础进行扩展。首先确认kibana运行正常并且已在上一步中正确填写kibana的IP地址、端口与协议,然后在filebeat机器中执行以下命令:
[root@filebeat-netflow ~]# /usr/bin/filebeat setup
稍等片刻,如果一切正常,返回的信息如下:
[root@filebeat-netflow filebeat]# filebeat setup
Overwriting ILM policy is disabled. Set `setup.ilm.overwrite:true` for enabling.

Index setup finished.
Loading dashboards (Kibana must be running and reachable)
Loaded dashboards
Setting up ML using setup --machine-learning is going to be removed in 8.0.0. Please use the ML app instead.
See more: https://www.elastic.co/guide/en/elastic-stack-overview/current/xpack-ml.html
Loaded machine learning job configurations
Loaded Ingest pipelines
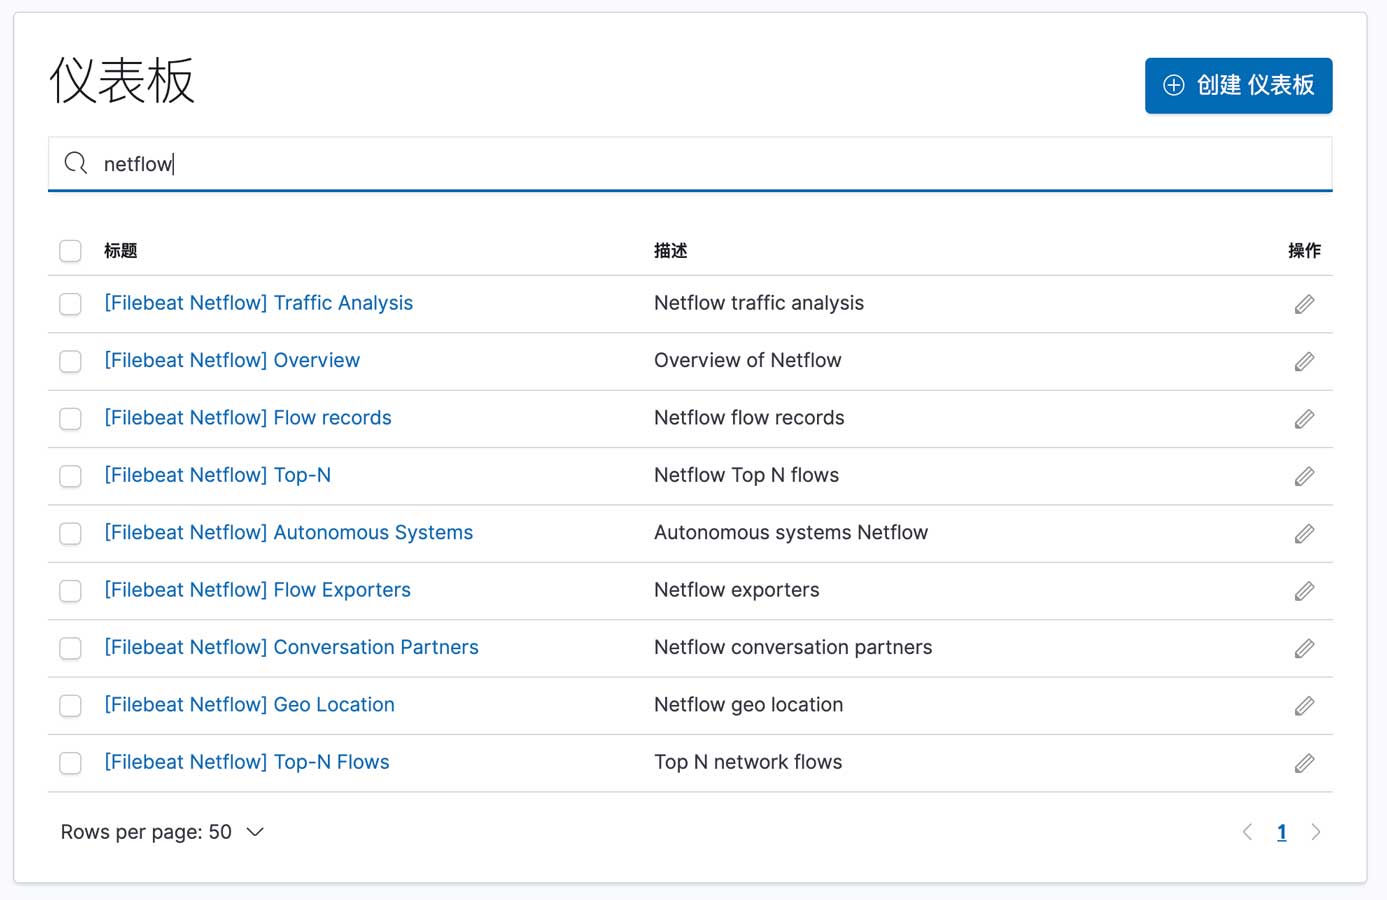
最后来到kibana的仪表盘可以发现多了许多条目,搜索后可以发现诸多与netflow有关的仪表盘:
使用开发工具查询模版可以发现有一个与filebeat相关的模版:
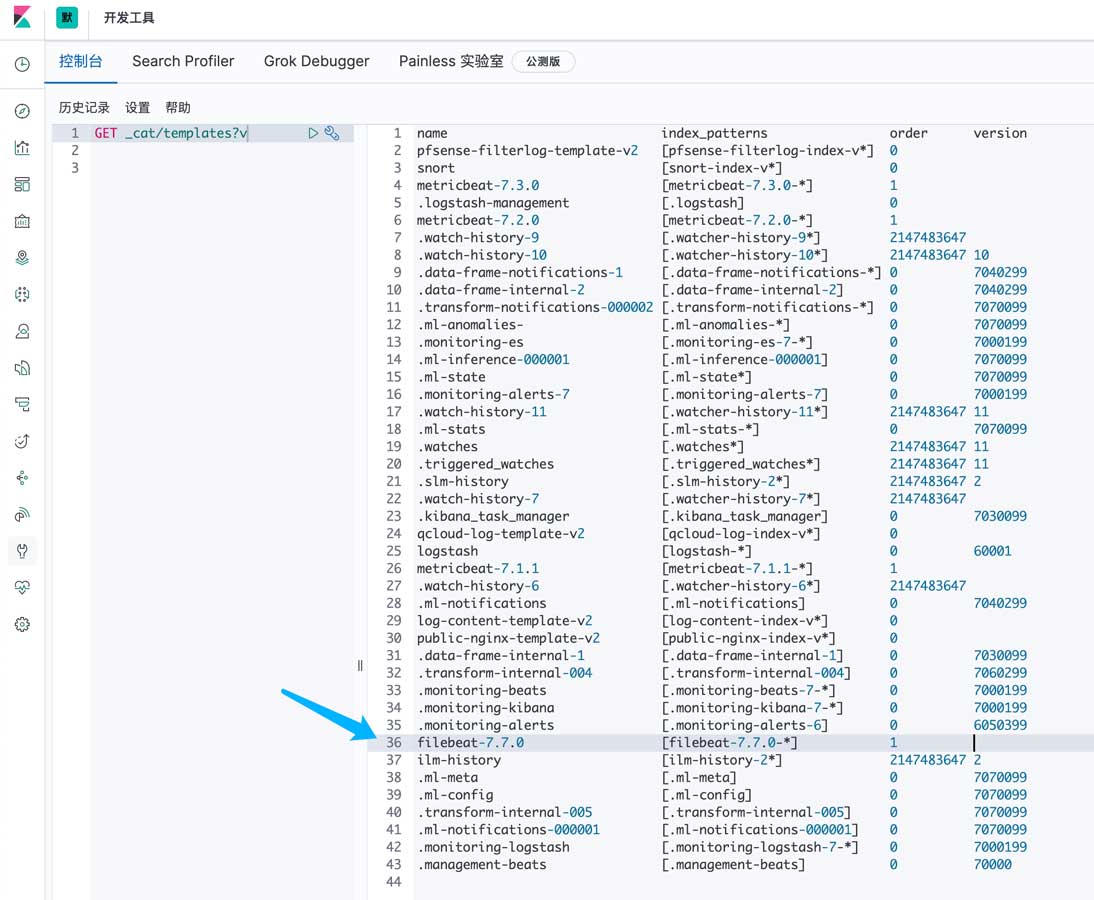
感兴趣的朋友可以使用以下命令查看:
GET _template/filebeat-7.7.0
此时来到SIEM页面应该是无数据的:

0x03.3 pfSense
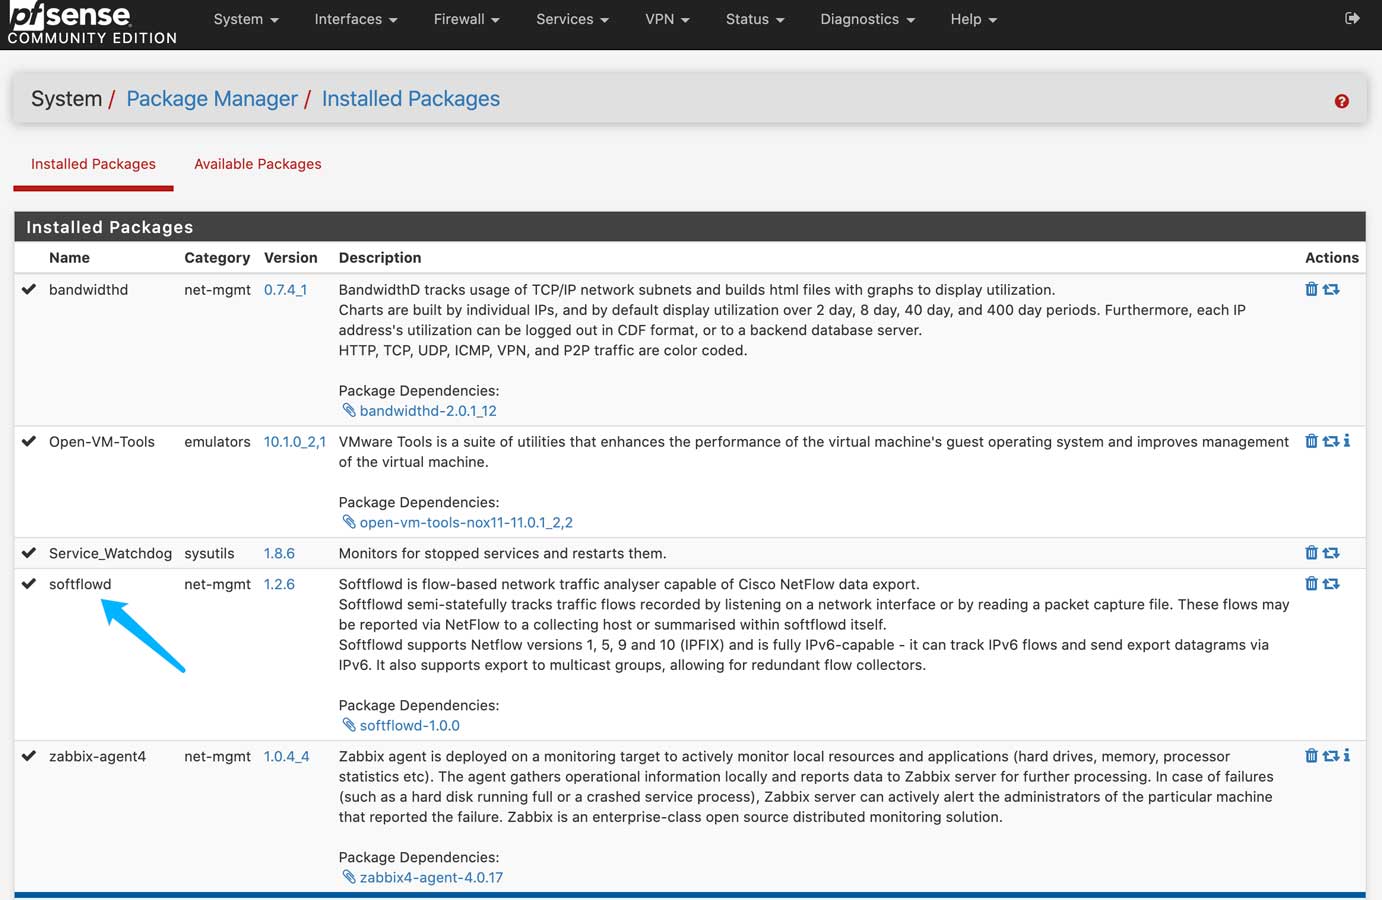
在一个优质网络的环境中安装softflowd:
然后进入配置界面:
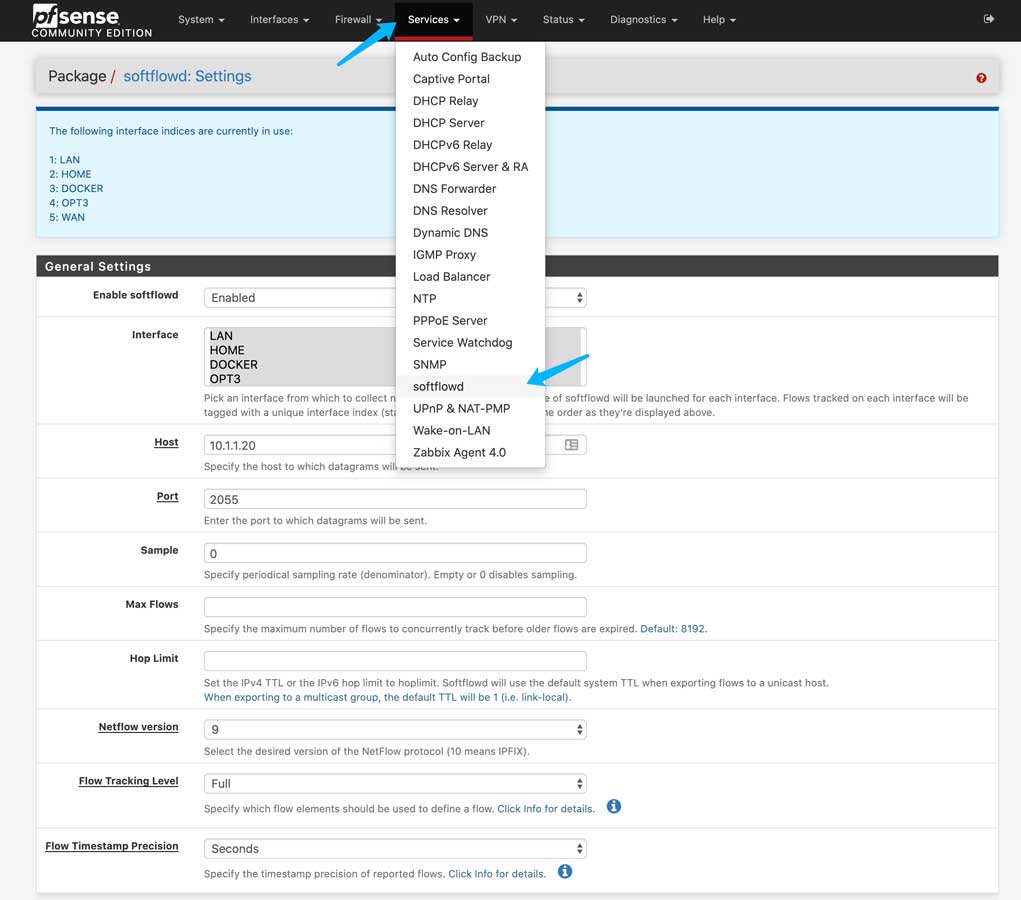
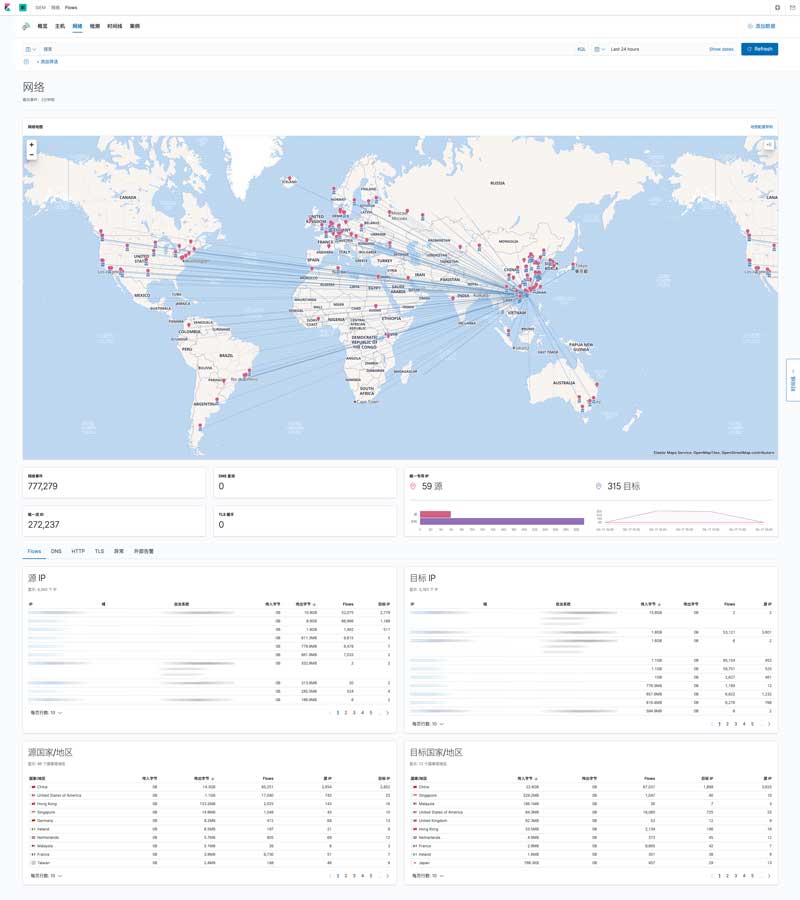
选择需要采样的interface、配置采集器的IP、端口、采样率等信息后单击页面底部的Save即可保存。稍等十几秒后即可回到kibana查看分析结果:
0x03.4 Centos
首先将二进制文件上传到系统中,然后将其赋予可执行权限并放置在适当的位置:
chmod +x flowexport_linux_x86_64.bin \
  && cp flowexport_linux_x86_64.bin /usr/local/sbin/flowexport
然后查看使用手册:
[root@b6b102 ~]# flowexport -h
Usage: flowexport [OPTIONS]...
Monitor traffic on interface and export NetFlow v5/v9 datagrams.

  -i IFACE            capture interface IFACE for monitoring (default: tries best match)
  -nf5 COLCTR [prt]   export NetFlow v5 datagrams to COLLECTOR host [optional port]
  -nf9 COLCTR [prt]   export NetFlow v9 datagrams to COLLECTOR host [optional port]
                      up to 16 total collector destinations may be specified.
  -t COUNT            create COUNT entries in the conntrack table (default: 8192)
  -T THREADS          spawn THREAD threads, each with COUNT/THREADS conntrack entries
  -s                  scan and display all interfaces and addresses on this host (exists)
  -d                  don't daemonize (REQUIRED for Windows command-line use!)
  -c FILE.conf        use specified configuration file
  -I FILE.conf        use ifindex file (format: "CIDR ifindex", not found defaults to ifindex=1)
  -f FILE.pcap        use pcap file instead of interface (Unix&Mac only!)
  -p                  don't put the sniff interface in promiscuous mode
  -a                  minimum age in seconds for a flow to be exportered (default: 30s)
  -e                  maximum number of seconds to wait before exporting anything (default: 120s)
  -FTHP               enable FlowTraq high precision extensions (only with NF9!)
  -guid XXXX-XX...    tag flows with GUID/CID (only for NF9!)
  -h                  this help

Version: 1.7  (build 871)
This software uses libpcap 1.0.0 (Unix) or
NetworkManager 3.2 (Windows) for packet capture.
(Note: NetworkManager 3.2 MUST be installed before running on Windows!)

Copyright (c)  2004-2017 by FlowTraq, Inc.
All rights reserved.
如果不知道系统中的网卡名字,可以使用以下命令列出:
[root@b6b102 ~]# flowexport -s
Interfaces found (ifName, ifIndex, addresses):
lo (1)  127.0.0.1 ::1
ens192 (2)  10.1.3.54 fe80::250:56ff:feb6:b102
docker0 (3)  172.17.0.1 fe80::42:88ff:fe5c:4989
可以使用 -i 指定网卡,也可以让它自行选择。准备好后执行命令即可:
[root@b6b102 ~]# flowexport -i ens192 -nf9 10.1.1.20 2055
[root@b6b102 ~]# 05/17/2020 18:38:01.253096  Using interface for sniffing: ens192
05/17/2020 18:38:01.297530  Exporting to 10.1.1.20 2055/UDP (slot 0)
默认以守护模式在后台运行,可以使用 -d 参数禁用守护模式。最后检查运行情况:
[root@b6b102 ~]# ps -aux | grep flow
root     32062  1.3  2.6 103728 55144 ?        Ssl  18:38   0:00 flowexport -i ens192 -nf9 10.1.1.20 2055
如果有必要,还可以将它放在自动启动文件中:
echo "flowexport -i ens192 -nf9 10.1.1.20 2055" >> /etc/rc.local \
  && chmod +x /etc/rc.d/rc.local
0x03.5 windows
windows的安装较为简单,可以使用CMD安装,也可以使用GUI安装。在安装FlowExport前需要安装WinPcap,两者都安装后还需要重启系统:

FlowExport的配置文件在以下文件夹内:
C:\Program Files (x86)\ProQueSys\Exporter
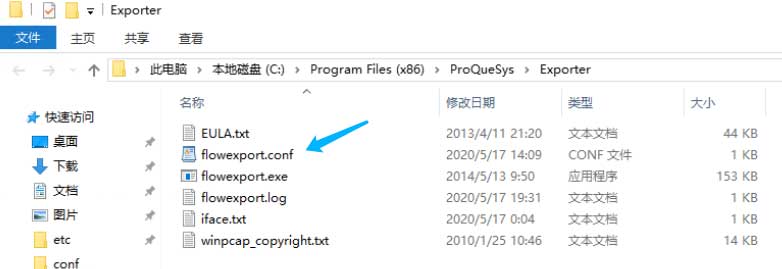
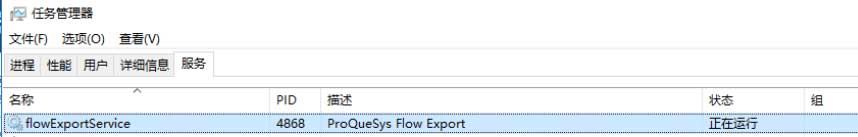
必要的时候可以进行修改,最后到任务管理器内确认服务处于正常运行状态即可:
0x04 结语
至此,所有安装配置的工作均已完成,到这里已经迈出了第一步,接下来要建立适用于自身情况的仪表盘和告警项。


服务器散热风扇的转速")


