
0x01 前言
在过去的两年,我一直使用HP的DL380 G6(我的HP ProLiant DL380 G6)。今年是2017年,如果从出厂日期算起来,它应该有6岁了。在这个月初,它终于要退休咯。
在上个月底的某一天的晚上,我在配置测试用的虚拟机,忽然听到一声闷闷的爆炸声并闻到一股电路板烧焦的味道。我立即意识到情况不妙,可是它依然撑着,直到我新购置的DELL R720的到来。
0x02 美图
首先上图,机子是机房淘汰下来的二手货,所以内部基本无尘,估计可以用个三五年。


0x03 配置
因为我可以将安装在DL380 G6中的内存条转移到R720中使用,所以我并没有购买内存条。大致的配置信息如下:
- CPU:E5-2650 两颗(关于CPU的信息请点击这里)
- 内存:4GB DDR3 ECC REG 24根共96GB
- 硬盘:
- 阵列1:4个DELL 1TB 7.2K 企业级硬盘并组建RAID10
- 阵列2:4个希捷2TB 7.2K 企业级硬盘并组建RAID10
- 网口:4个千兆电口,1个iDRAC管理口
- 其他:多个PCI接口可供拓展,前后各2个USB接口
我依旧为我的服务器配置KVM虚拟化服务(基于centos7的KVM配置),在经过几个小时的努力奋战,我终于将所有虚拟机都转移到R720上:
[root@server ~]# virsh list --all
 Id    Name                           State
----------------------------------------------------
 1     pfsense                        running
 2     freenas                        running
 3     sql                            running
 4     front                          running
 5     win10                          running
 6     server2012                     running
 8     plex                           running
 9     web                            running
 15    node3                          running
 16    node2                          running
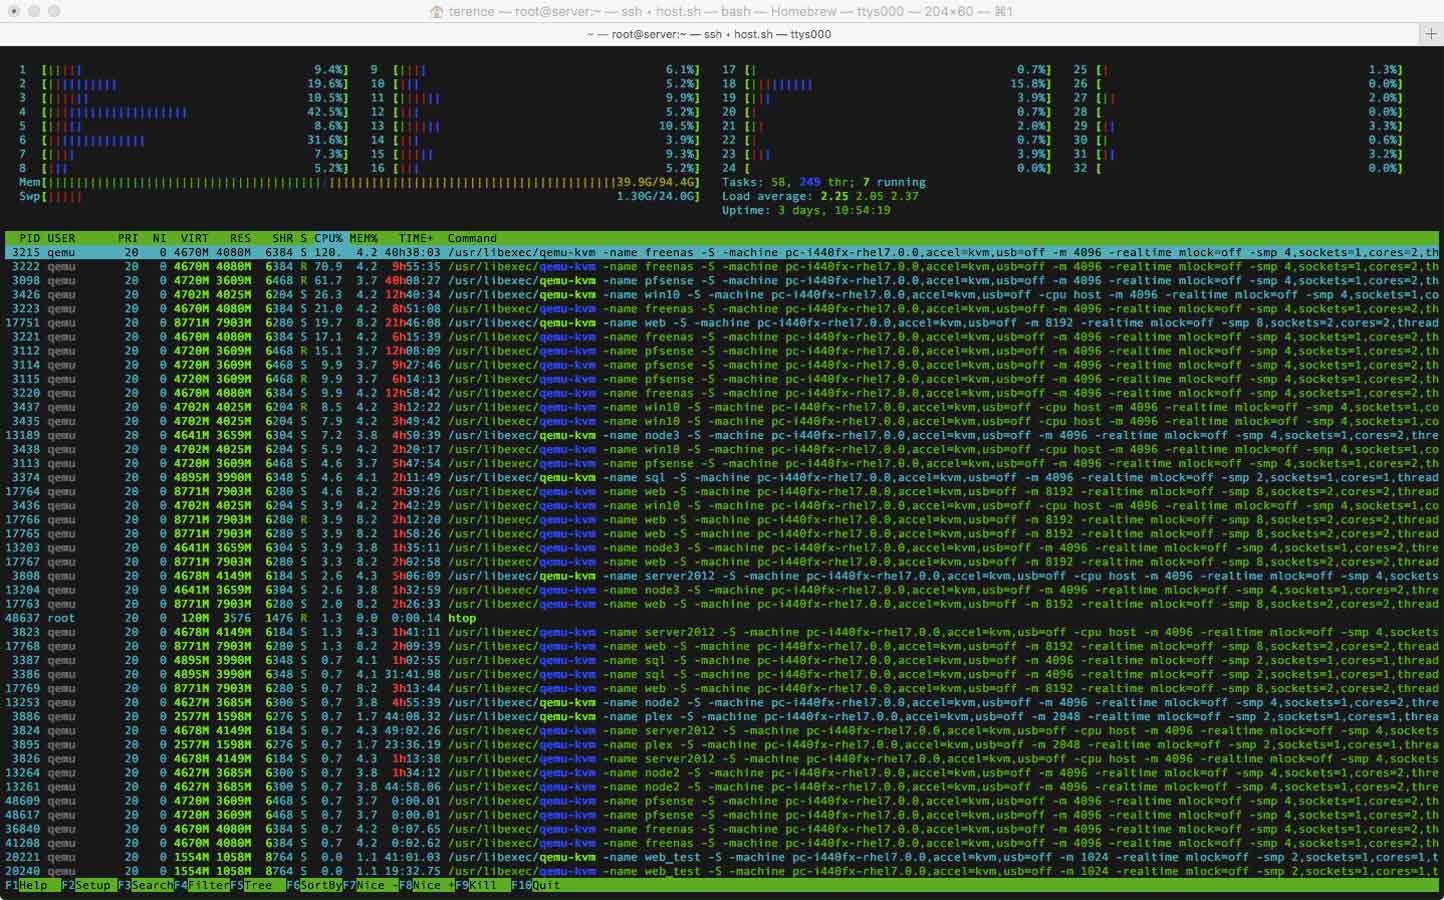
通过htop查看系统状态是这样的:
0x04 性能测试
0x04.1 UnixBench
------------------------------------------------------------------------
Benchmark Run: Fri Feb 24 2017 01:43:48 - 02:12:02
32 CPUs in system; running 1 parallel copy of tests

Dhrystone 2 using register variables       29330299.1 lps   (10.0 s, 7 samples)
Double-Precision Whetstone                     3419.3 MWIPS (10.0 s, 7 samples)
Execl Throughput                               2745.3 lps   (30.0 s, 2 samples)
File Copy 1024 bufsize 2000 maxblocks        794124.9 KBps  (30.0 s, 2 samples)
File Copy 256 bufsize 500 maxblocks          228489.9 KBps  (30.0 s, 2 samples)
File Copy 4096 bufsize 8000 maxblocks       1995967.4 KBps  (30.0 s, 2 samples)
Pipe Throughput                             1280438.8 lps   (10.0 s, 7 samples)
Pipe-based Context Switching                 148460.2 lps   (10.0 s, 7 samples)
Process Creation                               8199.9 lps   (30.0 s, 2 samples)
Shell Scripts (1 concurrent)                   5852.5 lpm   (60.0 s, 2 samples)
Shell Scripts (8 concurrent)                   3097.9 lpm   (60.0 s, 2 samples)
System Call Overhead                        1992937.4 lps   (10.0 s, 7 samples)

System Benchmarks Index Values               BASELINE       RESULT    INDEX
Dhrystone 2 using register variables         116700.0   29330299.1   2513.3
Double-Precision Whetstone                       55.0       3419.3    621.7
Execl Throughput                                 43.0       2745.3    638.5
File Copy 1024 bufsize 2000 maxblocks          3960.0     794124.9   2005.4
File Copy 256 bufsize 500 maxblocks            1655.0     228489.9   1380.6
File Copy 4096 bufsize 8000 maxblocks          5800.0    1995967.4   3441.3
Pipe Throughput                               12440.0    1280438.8   1029.3
Pipe-based Context Switching                   4000.0     148460.2    371.2
Process Creation                                126.0       8199.9    650.8
Shell Scripts (1 concurrent)                     42.4       5852.5   1380.3
Shell Scripts (8 concurrent)                      6.0       3097.9   5163.1
System Call Overhead                          15000.0    1992937.4   1328.6
                                                                   ========
System Benchmarks Index Score                                        1295.6

------------------------------------------------------------------------
Benchmark Run: Fri Feb 24 2017 02:12:02 - 02:12:02
32 CPUs in system; running 32 parallel copies of tests
0x04.2 阵列1 fio
[root@server fio-master]# ./fio -filename=/root/codex/test.fio -iodepth=64 -direct=1 -rw=randread -bs=4k -size=2G -numjobs=64 -runtime=20 -group_reporting -name=test-rand-read
test-rand-read: (g=0): rw=randread, bs=4096B-4096B,4096B-4096B,4096B-4096B, ioengine=psync, iodepth=64
...
fio-2.18
Starting 64 processes
test-rand-read: Laying out IO file(s) (1 file(s) / 2048MiB)
Jobs: 64 (f=64): [r(64)][100.0%][r=8780KiB/s,w=0KiB/s][r=2195,w=0 IOPS][eta 00m:00s]
test-rand-read: (groupid=0, jobs=64): err= 0: pid=3233: Fri Feb 24 02:27:29 2017
   read: IOPS=2095, BW=8382KiB/s (8583kB/s)(165MiB/20103msec)
    clat (usec): min=38, max=851727, avg=30431.68, stdev=45014.24
     lat (usec): min=38, max=851728, avg=30431.95, stdev=45014.25
    clat percentiles (usec):
     |  1.00th=[   46],  5.00th=[   54], 10.00th=[   74], 20.00th=[ 3952],
     | 30.00th=[ 6816], 40.00th=[ 9792], 50.00th=[14912], 60.00th=[21120],
     | 70.00th=[30336], 80.00th=[45824], 90.00th=[76288], 95.00th=[114176],
     | 99.00th=[220160], 99.50th=[268288], 99.90th=[399360], 99.95th=[448512],
     | 99.99th=[561152]
    lat (usec) : 50=2.48%, 100=8.74%, 250=1.33%, 500=0.07%, 750=0.02%
    lat (usec) : 1000=0.02%
    lat (msec) : 2=0.97%, 4=6.58%, 10=20.33%, 20=18.16%, 50=23.28%
    lat (msec) : 100=11.52%, 250=5.83%, 500=0.65%, 750=0.02%, 1000=0.01%
  cpu          : usr=0.02%, sys=0.07%, ctx=42415, majf=0, minf=2450
  IO depths    : 1=100.0%, 2=0.0%, 4=0.0%, 8=0.0%, 16=0.0%, 32=0.0%, >=64=0.0%
     submit    : 0=0.0%, 4=100.0%, 8=0.0%, 16=0.0%, 32=0.0%, 64=0.0%, >=64=0.0%
     complete  : 0=0.0%, 4=100.0%, 8=0.0%, 16=0.0%, 32=0.0%, 64=0.0%, >=64=0.0%
     issued rwt: total=42126,0,0, short=0,0,0, dropped=0,0,0
     latency   : target=0, window=0, percentile=100.00%, depth=64

Run status group 0 (all jobs):
   READ: bw=8382KiB/s (8583kB/s), 8382KiB/s-8382KiB/s (8583kB/s-8583kB/s), io=165MiB (173MB), run=20103-20103msec

Disk stats (read/write):
    dm-0: ios=41848/20, merge=0/0, ticks=1267538/8, in_queue=1269758, util=99.31%, aggrios=42170/28, aggrmerge=225/8, aggrticks=1324325/8, aggrin_queue=1324297, aggrutil=99.24%
  sda: ios=42170/28, merge=225/8, ticks=1324325/8, in_queue=1324297, util=99.24%

####################

[root@server fio-master]# ./fio -filename=/root/codex/test.fio -iodepth=64 -direct=1 -rw=randwrite -bs=4k -size=2G -numjobs=64 -runtime=20 -group_reporting -name=test-rand-write
test-rand-write: (g=0): rw=randwrite, bs=4096B-4096B,4096B-4096B,4096B-4096B, ioengine=psync, iodepth=64
...
fio-2.18
Starting 64 processes
Jobs: 64 (f=64): [w(64)][100.0%][r=0KiB/s,w=4160KiB/s][r=0,w=1040 IOPS][eta 00m:00s]
test-rand-write: (groupid=0, jobs=64): err= 0: pid=3579: Fri Feb 24 02:28:58 2017
  write: IOPS=1268, BW=5074KiB/s (5196kB/s)(99.5MiB/20074msec)
    clat (usec): min=39, max=393395, avg=50347.42, stdev=31166.47
     lat (usec): min=39, max=393396, avg=50347.87, stdev=31166.50
    clat percentiles (usec):
     |  1.00th=[ 1128],  5.00th=[ 1544], 10.00th=[ 9920], 20.00th=[34048],
     | 30.00th=[48384], 40.00th=[52480], 50.00th=[55040], 60.00th=[57600],
     | 70.00th=[60160], 80.00th=[63744], 90.00th=[68096], 95.00th=[73216],
     | 99.00th=[107008], 99.50th=[292864], 99.90th=[378880], 99.95th=[387072],
     | 99.99th=[391168]
    lat (usec) : 50=0.04%, 100=0.25%, 250=0.04%, 500=0.02%, 750=0.04%
    lat (usec) : 1000=0.15%
    lat (msec) : 2=8.25%, 4=0.64%, 10=0.62%, 20=8.15%, 50=15.30%
    lat (msec) : 100=65.24%, 250=0.77%, 500=0.50%
  cpu          : usr=0.01%, sys=0.05%, ctx=25905, majf=0, minf=2378
  IO depths    : 1=100.0%, 2=0.0%, 4=0.0%, 8=0.0%, 16=0.0%, 32=0.0%, >=64=0.0%
     submit    : 0=0.0%, 4=100.0%, 8=0.0%, 16=0.0%, 32=0.0%, 64=0.0%, >=64=0.0%
     complete  : 0=0.0%, 4=100.0%, 8=0.0%, 16=0.0%, 32=0.0%, 64=0.0%, >=64=0.0%
     issued rwt: total=0,25465,0, short=0,0,0, dropped=0,0,0
     latency   : target=0, window=0, percentile=100.00%, depth=64

Run status group 0 (all jobs):
  WRITE: bw=5074KiB/s (5196kB/s), 5074KiB/s-5074KiB/s (5196kB/s-5196kB/s), io=99.5MiB (104MB), run=20074-20074msec

Disk stats (read/write):
    dm-0: ios=1/25450, merge=0/0, ticks=1568/1279986, in_queue=1285270, util=99.37%, aggrios=8/25575, aggrmerge=40/14, aggrticks=8697/1293441, aggrin_queue=1302122, aggrutil=99.25%
  sda: ios=8/25575, merge=40/14, ticks=8697/1293441, in_queue=1302122, util=99.25%
0x04.3 阵列2 fio
[root@server fio-master]# ./fio -filename=/disk2/test.fio -iodepth=64 -direct=1 -rw=randread -bs=4k -size=2G -numjobs=64 -runtime=20 -group_reporting -name=test-rand-read
test-rand-read: (g=0): rw=randread, bs=4096B-4096B,4096B-4096B,4096B-4096B, ioengine=psync, iodepth=64
...
fio-2.18
Starting 64 processes
test-rand-read: Laying out IO file(s) (1 file(s) / 2048MiB)
Jobs: 64 (f=64): [r(64)][100.0%][r=3700KiB/s,w=0KiB/s][r=925,w=0 IOPS][eta 00m:00s]
test-rand-read: (groupid=0, jobs=64): err= 0: pid=4314: Fri Feb 24 02:31:56 2017
   read: IOPS=922, BW=3689KiB/s (3777kB/s)(72.5MiB/20110msec)
    clat (usec): min=37, max=1542.1k, avg=69146.52, stdev=128982.55
     lat (usec): min=38, max=1542.1k, avg=69146.82, stdev=128982.57
    clat percentiles (usec):
     |  1.00th=[   48],  5.00th=[   59], 10.00th=[   94], 20.00th=[ 4448],
     | 30.00th=[ 8384], 40.00th=[14144], 50.00th=[24448], 60.00th=[40192],
     | 70.00th=[61696], 80.00th=[92672], 90.00th=[166912], 95.00th=[284672],
     | 99.00th=[741376], 99.50th=[839680], 99.90th=[1028096], 99.95th=[1171456],
     | 99.99th=[1400832]
    lat (usec) : 50=1.43%, 100=8.90%, 250=2.09%, 500=0.81%, 750=0.56%
    lat (usec) : 1000=0.45%
    lat (msec) : 2=0.62%, 4=3.86%, 10=15.55%, 20=12.43%, 50=18.45%
    lat (msec) : 100=16.48%, 250=12.52%, 500=3.75%, 750=1.16%, 1000=0.86%
    lat (msec) : 2000=0.11%
  cpu          : usr=0.01%, sys=0.03%, ctx=18814, majf=0, minf=2444
  IO depths    : 1=100.0%, 2=0.0%, 4=0.0%, 8=0.0%, 16=0.0%, 32=0.0%, >=64=0.0%
     submit    : 0=0.0%, 4=100.0%, 8=0.0%, 16=0.0%, 32=0.0%, 64=0.0%, >=64=0.0%
     complete  : 0=0.0%, 4=100.0%, 8=0.0%, 16=0.0%, 32=0.0%, 64=0.0%, >=64=0.0%
     issued rwt: total=18546,0,0, short=0,0,0, dropped=0,0,0
     latency   : target=0, window=0, percentile=100.00%, depth=64

Run status group 0 (all jobs):
   READ: bw=3689KiB/s (3777kB/s), 3689KiB/s-3689KiB/s (3777kB/s-3777kB/s), io=72.5MiB (75.1MB), run=20110-20110msec

Disk stats (read/write):
  sdb: ios=18536/8527, merge=0/28, ticks=1280315/1964, in_queue=1283629, util=99.78%

########################################

[root@server fio-master]# ./fio -filename=/disk2/test.fio -iodepth=64 -direct=1 -rw=randwrite -bs=4k -size=2G -numjobs=64 -runtime=20 -group_reporting -name=test-rand-write
test-rand-write: (g=0): rw=randwrite, bs=4096B-4096B,4096B-4096B,4096B-4096B, ioengine=psync, iodepth=64
...
fio-2.18
Starting 64 processes
Jobs: 64 (f=64): [w(64)][100.0%][r=0KiB/s,w=616KiB/s][r=0,w=154 IOPS][eta 00m:00s]
test-rand-write: (groupid=0, jobs=64): err= 0: pid=4549: Fri Feb 24 02:33:07 2017
  write: IOPS=279, BW=1119KiB/s (1146kB/s)(22.5MiB/20520msec)
    clat (usec): min=40, max=6280.5k, avg=225537.91, stdev=834719.90
     lat (usec): min=40, max=6280.5k, avg=225538.38, stdev=834719.93
    clat percentiles (usec):
     |  1.00th=[   46],  5.00th=[   50], 10.00th=[   61], 20.00th=[  133],
     | 30.00th=[  282], 40.00th=[ 3504], 50.00th=[ 4512], 60.00th=[ 6048],
     | 70.00th=[ 9536], 80.00th=[17792], 90.00th=[175104], 95.00th=[1728512],
     | 99.00th=[4947968], 99.50th=[5668864], 99.90th=[6127616], 99.95th=[6193152],
     | 99.99th=[6258688]
    lat (usec) : 50=4.89%, 100=11.54%, 250=10.57%, 500=5.92%, 750=1.57%
    lat (usec) : 1000=1.10%
    lat (msec) : 2=2.14%, 4=8.31%, 10=24.88%, 20=9.91%, 50=4.86%
    lat (msec) : 100=2.89%, 250=1.60%, 500=1.45%, 750=0.77%, 1000=0.57%
    lat (msec) : 2000=3.13%, >=2000=3.90%
  cpu          : usr=0.00%, sys=0.02%, ctx=11626, majf=0, minf=2393
  IO depths    : 1=100.0%, 2=0.0%, 4=0.0%, 8=0.0%, 16=0.0%, 32=0.0%, >=64=0.0%
     submit    : 0=0.0%, 4=100.0%, 8=0.0%, 16=0.0%, 32=0.0%, 64=0.0%, >=64=0.0%
     complete  : 0=0.0%, 4=100.0%, 8=0.0%, 16=0.0%, 32=0.0%, 64=0.0%, >=64=0.0%
     issued rwt: total=0,5743,0, short=0,0,0, dropped=0,0,0
     latency   : target=0, window=0, percentile=100.00%, depth=64

Run status group 0 (all jobs):
  WRITE: bw=1119KiB/s (1146kB/s), 1119KiB/s-1119KiB/s (1146kB/s-1146kB/s), io=22.5MiB (23.6MB), run=20520-20520msec

Disk stats (read/write):
  sdb: ios=0/7953, merge=0/29, ticks=0/52441, in_queue=52435, util=98.75%
0x05 结语
因为服务器上已经有服务在运行,负载也挺高的,所以上面的测试结果并不能代表真正的性能。但总体来说是比我之前的DL380 G6要好,毕竟年代都不一样。
0x06 视频
- EP2- Dell R720机架式服务器硬件介绍
https://www.bilibili.com/video/av10377913/
- YouTube:EP2- Dell R720机架式服务器硬件介绍
0x07 广告
以下是购买链接:
https://item.taobao.com/item.htm?spm=a1z09.2.0.0.2ed6e79755TeCW&id=532131383427&_u=t28cvgc4960


