
0x01 ProLiant DL380 G6
在2015年的8月,我从淘宝买了一台服务器,本来是想学习虚拟化技术的,谁知这坑越踩越深,现在深陷在服务器里面不能自拔。以下是服务器配置:
- 型号:ProLiant DL380 G6
- CPU:Intel Xeon L5630 X2(每颗CPU4核心8线程,一共16线程)
- 内存:4GB DDR3 1066 ECC X8(一共32GB内存)
- RAID卡:HP P410i SAS RAID 256M缓存(组建RAID 10)
- 硬盘:300GB 10K 热插拔 2.5寸硬盘 X4(一共1TB,可用约500GB)
- 网口:1000M自适应网口 X2,100M iLO网口 X1
0x02 前面板
- UID按钮
- 状态灯
- 开关机按钮
- 两个USB2.0接口
- 一个VGA接口
- 网络、CPU、内存、散热风扇错误、信息提示灯。
- 旁边是硬盘,硬盘架子不是一样的,可是硬盘都是300GB 10K。

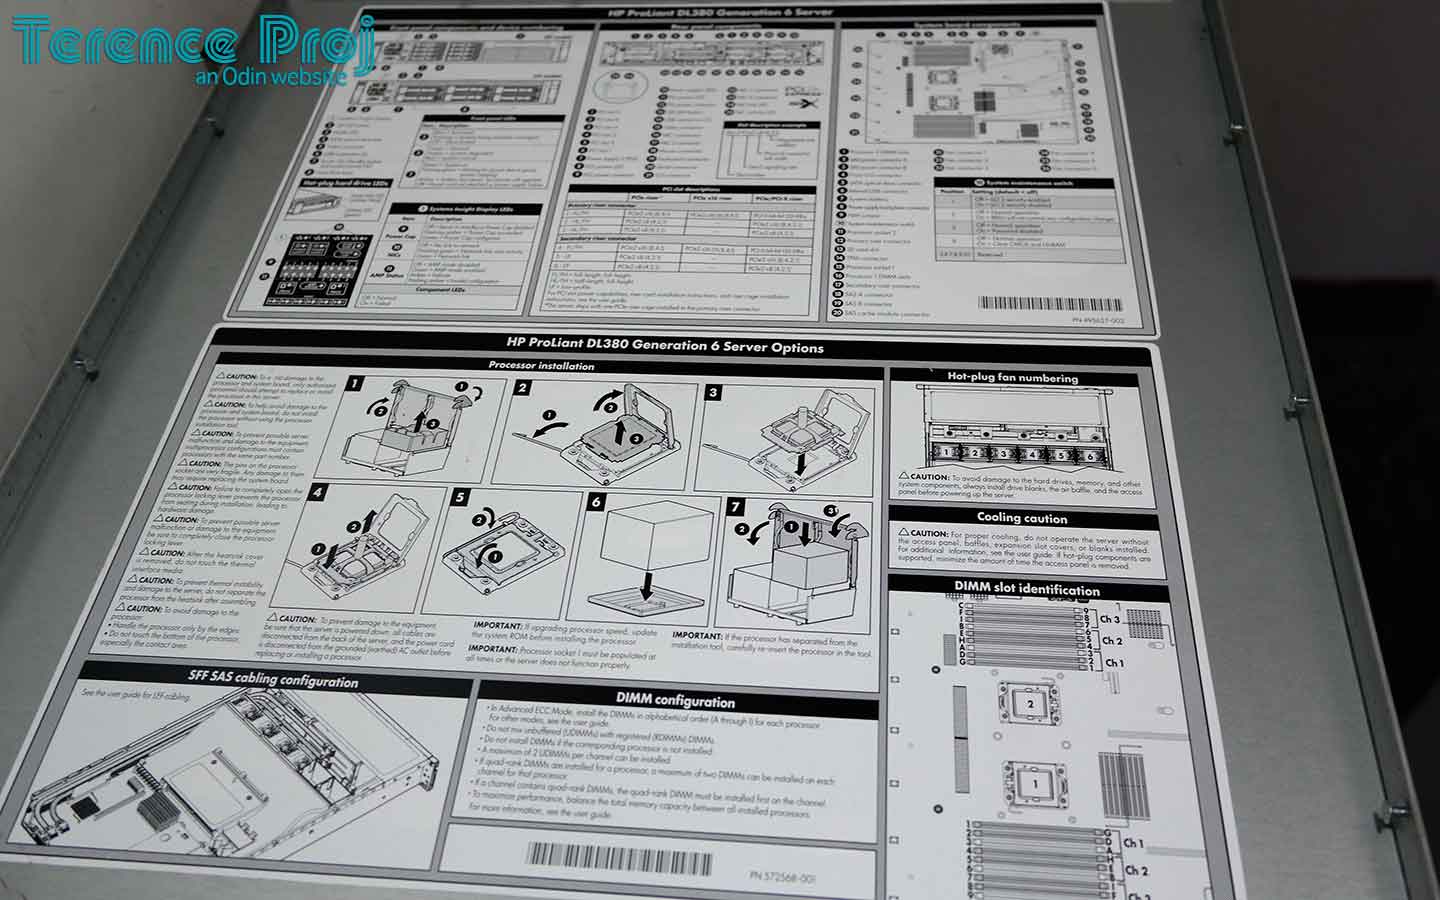
0x03 盖子背面 | 服务器说明书
服务器都会在盖子背面贴上安装说明书,大都是关于内存与CPU拆卸和安装的信息。我想应该是大家买到服务器后,说明书一般不会长时间保留的原因。
0x04 磁盘阵列
它可以承载最多8块硬盘,可惜我现在只有4块。这服务器主要用作运算,我并不打算继续添加硬盘。反而计划增添一台存储服务器,用于数据的存储。当然,存储服务器也不会使用RAID10,肯定要选择更安全的阵列。

0x05 散热风扇
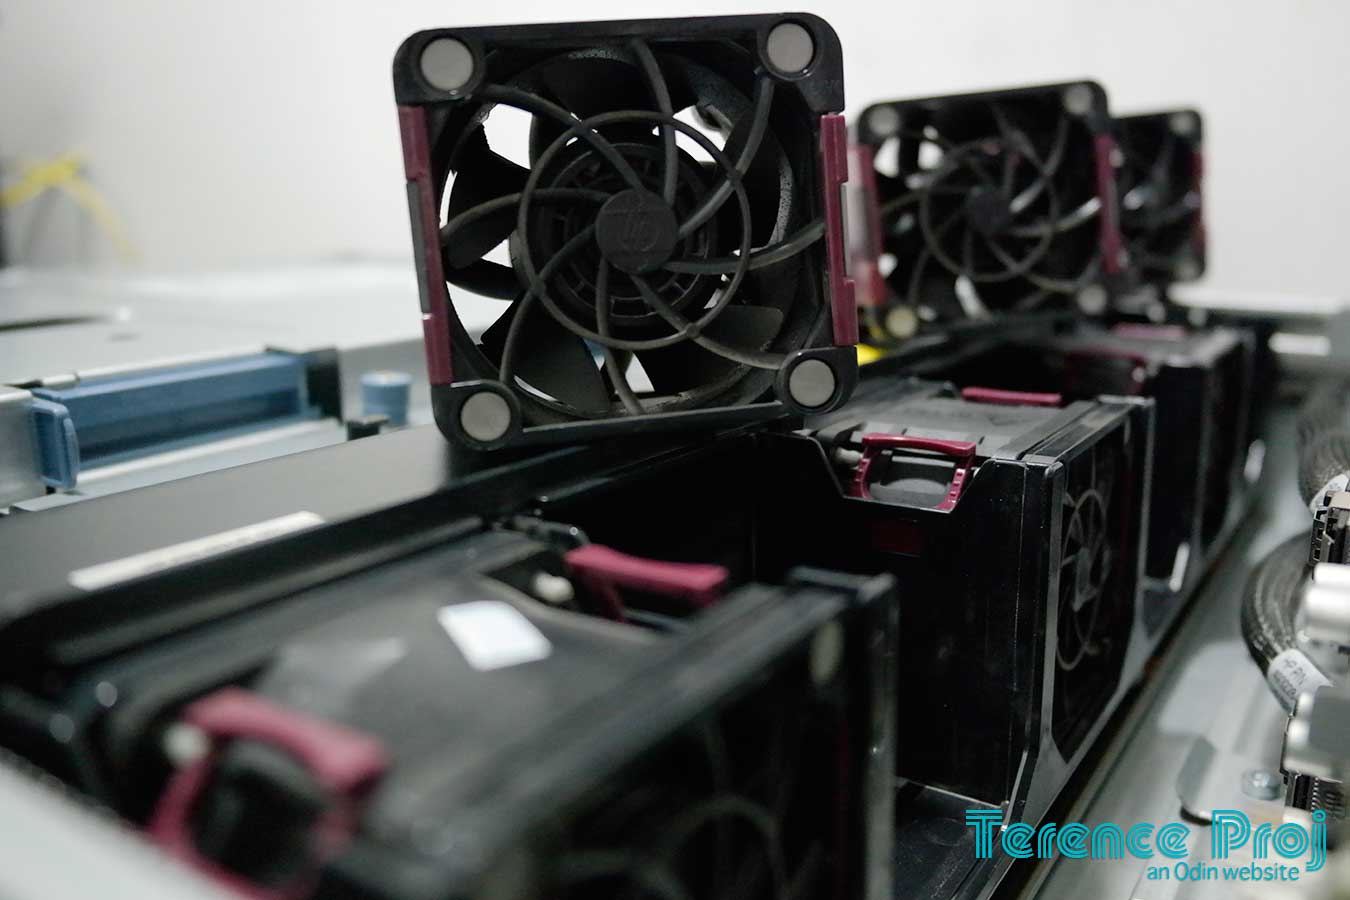
6个热插拔散热风扇。免工具拆卸,方便服务器在运转的时候更换坏掉的风扇。当拆掉一个后,其他5个会全速运转,声音大得无法形容。当拆掉2个,必须在规定时间内装回,要不然服务会停机!
0x06 视频
- 国内访客(bilibili):EP3 – HP DL380 G6机架式服务器硬件介绍
- 国外访客(YouTube):EP3 – HP DL380 G6机架式服务器硬件介绍
0x07 性能测试
- UnixBench
–0x07.1 UnixBench
Benchmark Run: 三 5月 25 2016 16:48:58 - 17:16:54
16 CPUs in system; running 1 parallel copy of tests

Dhrystone 2 using register variables       16206487.9 lps   (10.0 s, 7 samples)
Double-Precision Whetstone                     2094.9 MWIPS (10.0 s, 7 samples)
Execl Throughput                               1880.6 lps   (29.9 s, 2 samples)
File Copy 1024 bufsize 2000 maxblocks        555321.1 KBps  (30.0 s, 2 samples)
File Copy 256 bufsize 500 maxblocks          150458.4 KBps  (30.0 s, 2 samples)
File Copy 4096 bufsize 8000 maxblocks       1335622.3 KBps  (30.0 s, 2 samples)
Pipe Throughput                              835680.3 lps   (10.0 s, 7 samples)
Pipe-based Context Switching                  96242.9 lps   (10.0 s, 7 samples)
Process Creation                               3969.6 lps   (30.0 s, 2 samples)
Shell Scripts (1 concurrent)                   3926.8 lpm   (60.0 s, 2 samples)
Shell Scripts (8 concurrent)                   1922.2 lpm   (60.0 s, 2 samples)
System Call Overhead                        1101238.5 lps   (10.0 s, 7 samples)

System Benchmarks Index Values               BASELINE       RESULT    INDEX
Dhrystone 2 using register variables         116700.0   16206487.9   1388.7
Double-Precision Whetstone                       55.0       2094.9    380.9
Execl Throughput                                 43.0       1880.6    437.3
File Copy 1024 bufsize 2000 maxblocks          3960.0     555321.1   1402.3
File Copy 256 bufsize 500 maxblocks            1655.0     150458.4    909.1
File Copy 4096 bufsize 8000 maxblocks          5800.0    1335622.3   2302.8
Pipe Throughput                               12440.0     835680.3    671.8
Pipe-based Context Switching                   4000.0      96242.9    240.6
Process Creation                                126.0       3969.6    315.0
Shell Scripts (1 concurrent)                     42.4       3926.8    926.1
Shell Scripts (8 concurrent)                      6.0       1922.2   3203.7
System Call Overhead                          15000.0    1101238.5    734.2
                                                                   ========
System Benchmarks Index Score                                         806.1

------------------------------------------------------------------------
Benchmark Run: 三 5月 25 2016 17:16:54 - 17:44:54
16 CPUs in system; running 16 parallel copies of tests

Dhrystone 2 using register variables      141482584.4 lps   (10.0 s, 7 samples)
Double-Precision Whetstone                    27775.4 MWIPS (10.0 s, 7 samples)
Execl Throughput                              19842.8 lps   (30.0 s, 2 samples)
File Copy 1024 bufsize 2000 maxblocks        578595.7 KBps  (30.0 s, 2 samples)
File Copy 256 bufsize 500 maxblocks          166235.2 KBps  (30.0 s, 2 samples)
File Copy 4096 bufsize 8000 maxblocks       1660277.2 KBps  (30.0 s, 2 samples)
Pipe Throughput                             7668411.9 lps   (10.0 s, 7 samples)
Pipe-based Context Switching                1288364.2 lps   (10.0 s, 7 samples)
Process Creation                              54667.0 lps   (30.0 s, 2 samples)
Shell Scripts (1 concurrent)                  31482.8 lpm   (60.0 s, 2 samples)
Shell Scripts (8 concurrent)                   4221.8 lpm   (60.0 s, 2 samples)
System Call Overhead                        4682219.2 lps   (10.0 s, 7 samples)

System Benchmarks Index Values               BASELINE       RESULT    INDEX
Dhrystone 2 using register variables         116700.0  141482584.4  12123.6
Double-Precision Whetstone                       55.0      27775.4   5050.1
Execl Throughput                                 43.0      19842.8   4614.6
File Copy 1024 bufsize 2000 maxblocks          3960.0     578595.7   1461.1
File Copy 256 bufsize 500 maxblocks            1655.0     166235.2   1004.4
File Copy 4096 bufsize 8000 maxblocks          5800.0    1660277.2   2862.5
Pipe Throughput                               12440.0    7668411.9   6164.3
Pipe-based Context Switching                   4000.0    1288364.2   3220.9
Process Creation                                126.0      54667.0   4338.7
Shell Scripts (1 concurrent)                     42.4      31482.8   7425.2
Shell Scripts (8 concurrent)                      6.0       4221.8   7036.3
System Call Overhead                          15000.0    4682219.2   3121.5
                                                                   ========
System Benchmarks Index Score                                        3998.0
–0x07.2 fio
4k读取,我的是机械硬盘,这测试只是临时做的,有空再做个详尽的测试。
[root@server bin]# ./fio -filename=/root/codex/test.fio -iodepth=64 -direct=1 -rw=randread -bs=4k -size=2G -numjobs=64 -runtime=20 -group_reporting -name=test-rand-read
test-rand-read: (g=0): rw=randread, bs=4K-4K/4K-4K/4K-4K, ioengine=psync, iodepth=64
...
fio-2.11
Starting 64 processes
test-rand-read: Laying out IO file(s) (1 file(s) / 2048MB)
Jobs: 64 (f=64): [r(64)] [100.0% done] [5900KB/0KB/0KB /s] [1475/0/0 iops] [eta 00m:00s]
test-rand-read: (groupid=0, jobs=64): err= 0: pid=14221: Wed May 25 18:22:44 2016
  read : io=111680KB, bw=5566.8KB/s, iops=1391, runt= 20062msec
    clat (msec): min=1, max=465, avg=45.89, stdev=30.87
     lat (msec): min=1, max=465, avg=45.89, stdev=30.87
    clat percentiles (msec):
     |  1.00th=[    9],  5.00th=[   13], 10.00th=[   18], 20.00th=[   24],
     | 30.00th=[   31], 40.00th=[   37], 50.00th=[   43], 60.00th=[   48],
     | 70.00th=[   55], 80.00th=[   62], 90.00th=[   74], 95.00th=[   89],
     | 99.00th=[  145], 99.50th=[  192], 99.90th=[  404], 99.95th=[  424],
     | 99.99th=[  445]
    bw (KB  /s): min=    8, max=  145, per=1.57%, avg=87.17, stdev=19.58
    lat (msec) : 2=0.01%, 4=0.02%, 10=1.99%, 20=12.14%, 50=49.12%
    lat (msec) : 100=33.62%, 250=2.84%, 500=0.27%
  cpu          : usr=0.02%, sys=0.08%, ctx=28829, majf=0, minf=2088
  IO depths    : 1=100.0%, 2=0.0%, 4=0.0%, 8=0.0%, 16=0.0%, 32=0.0%, >=64=0.0%
     submit    : 0=0.0%, 4=100.0%, 8=0.0%, 16=0.0%, 32=0.0%, 64=0.0%, >=64=0.0%
     complete  : 0=0.0%, 4=100.0%, 8=0.0%, 16=0.0%, 32=0.0%, 64=0.0%, >=64=0.0%
     issued    : total=r=27920/w=0/d=0, short=r=0/w=0/d=0, drop=r=0/w=0/d=0
     latency   : target=0, window=0, percentile=100.00%, depth=64

Run status group 0 (all jobs):
   READ: io=111680KB, aggrb=5566KB/s, minb=5566KB/s, maxb=5566KB/s, mint=20062msec, maxt=20062msec

Disk stats (read/write):
    dm-0: ios=27627/10, merge=0/0, ticks=1262991/1202, in_queue=1269985, util=99.43%, aggrios=27915/9, aggrmerge=5/1, aggrticks=1279594/1060, aggrin_queue=1280634, aggrutil=99.32%
  sda: ios=27915/9, merge=5/1, ticks=1279594/1060, in_queue=1280634, util=99.32%
4k写入,我的是机械硬盘,这测试只是临时做的,有空再做个详尽的测试。
[root@server bin]# ./fio -filename=/home/test -iodepth=64 -direct=1 -rw=randwrite -bs=4k -size=2G -numjobs=64 -runtime=20 -group_reporting -name=test-rand-write
test-rand-write: (g=0): rw=randwrite, bs=4K-4K/4K-4K/4K-4K, ioengine=psync, iodepth=64
...
fio-2.11
Starting 64 processes
test-rand-write: Laying out IO file(s) (1 file(s) / 2048MB)
Jobs: 64 (f=64): [w(64)] [100.0% done] [0KB/2540KB/0KB /s] [0/635/0 iops] [eta 00m:00s]
test-rand-write: (groupid=0, jobs=64): err= 0: pid=14323: Wed May 25 18:24:39 2016
  write: io=44768KB, bw=2225.9KB/s, iops=556, runt= 20113msec
    clat (msec): min=8, max=1635, avg=114.64, stdev=103.15
     lat (msec): min=8, max=1635, avg=114.64, stdev=103.15
    clat percentiles (msec):
     |  1.00th=[   20],  5.00th=[   31], 10.00th=[   40], 20.00th=[   56],
     | 30.00th=[   70], 40.00th=[   84], 50.00th=[   97], 60.00th=[  111],
     | 70.00th=[  125], 80.00th=[  141], 90.00th=[  169], 95.00th=[  245],
     | 99.00th=[  676], 99.50th=[  799], 99.90th=[  873], 99.95th=[  947],
     | 99.99th=[ 1614]
    bw (KB  /s): min=    8, max=   80, per=1.61%, avg=35.92, stdev=13.13
    lat (msec) : 10=0.01%, 20=1.06%, 50=15.17%, 100=36.10%, 250=42.74%
    lat (msec) : 500=3.63%, 750=0.59%, 1000=0.66%, 2000=0.04%
  cpu          : usr=0.01%, sys=0.06%, ctx=13041, majf=0, minf=1979
  IO depths    : 1=100.0%, 2=0.0%, 4=0.0%, 8=0.0%, 16=0.0%, 32=0.0%, >=64=0.0%
     submit    : 0=0.0%, 4=100.0%, 8=0.0%, 16=0.0%, 32=0.0%, 64=0.0%, >=64=0.0%
     complete  : 0=0.0%, 4=100.0%, 8=0.0%, 16=0.0%, 32=0.0%, 64=0.0%, >=64=0.0%
     issued    : total=r=0/w=11192/d=0, short=r=0/w=0/d=0, drop=r=0/w=0/d=0
     latency   : target=0, window=0, percentile=100.00%, depth=64

Run status group 0 (all jobs):
  WRITE: io=44768KB, aggrb=2225KB/s, minb=2225KB/s, maxb=2225KB/s, mint=20113msec, maxt=20113msec

Disk stats (read/write):
    dm-0: ios=0/11113, merge=0/0, ticks=0/1267349, in_queue=1275303, util=99.36%, aggrios=0/11192, aggrmerge=0/12, aggrticks=0/1282840, aggrin_queue=1282828, aggrutil=99.27%
  sda: ios=0/11192, merge=0/12, ticks=0/1282840, in_queue=1282828, util=99.27%
0x08 美图


0x09 相关视频
- EP3 – HP DL380 G6机架式服务器硬件介绍
https://www.bilibili.com/video/av10414203/


")


