0x01 前言
测试环境与服务环境肯定不能少了windows系列的系统,对windows系统的一些参数进行监控以便日后分析也是挺重要的。
0x02 准备
首先得准备zabbix服务器,以便等下添加监控点。zabbix服务器的配置方式可参考一下文章:
然后下载新版的zabbix agents for windows,通过一下页面即可找到最新版本:
http://www.zabbix.com/download
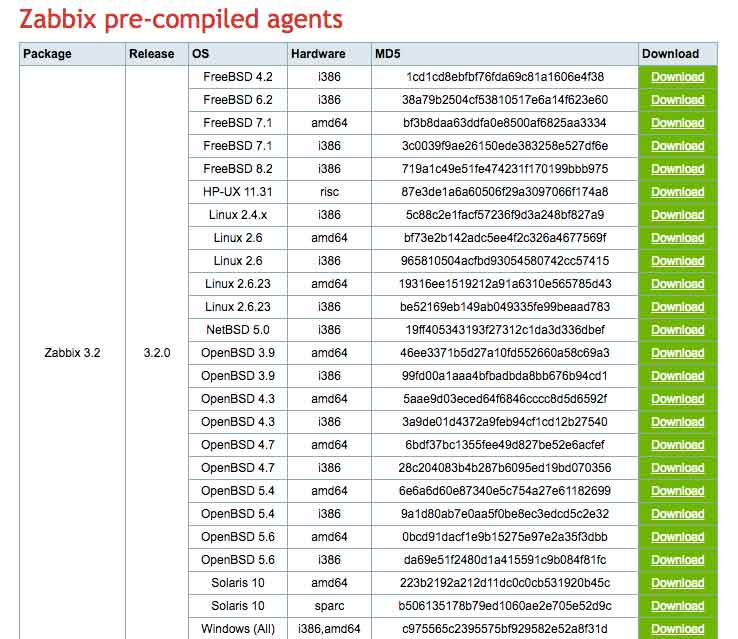
在最后一行即可找到适用于所有windows版本的zabbix agents。下载并解压后包含两个文件夹:

bin文件夹内包含有适用于win32的程序与适用于win64的程序;conf文件夹内包含有配置文件的模版。
0x03 配置文件
首先将配置文件复制一份作为备份,然后进行修改。首先定位到第84行,指定服务器IP,未指定IP的服务器将无法与agents建立链接:
### Option: Server
#	List of comma delimited IP addresses (or hostnames) of Zabbix servers.
#	Incoming connections will be accepted only from the hosts listed here.
#	If IPv6 support is enabled then '127.0.0.1', '::127.0.0.1', '::ffff:127.0.0.1' are treated equally.
#
# Mandatory: no
# Default:
# Server=

Server=127.0.0.1
定位到第125行,修改IP地址为zabbix的服务器,用于检测服务器状态:
### Option: ServerActive
#	List of comma delimited IP:port (or hostname:port) pairs of Zabbix servers for active checks.
#	If port is not specified, default port is used.
#	IPv6 addresses must be enclosed in square brackets if port for that host is specified.
#	If port is not specified, square brackets for IPv6 addresses are optional.
#	If this parameter is not specified, active checks are disabled.
#	Example: ServerActive=127.0.0.1:20051,zabbix.domain,[::1]:30051,::1,[12fc::1]
#
# Mandatory: no
# Default:
# ServerActive=

ServerActive=127.0.0.1
定位到第136行,修改hostname,用于在zabbix服务器端识别:
### Option: Hostname
#	Unique, case sensitive hostname.
#	Required for active checks and must match hostname as configured on the server.
#	Value is acquired from HostnameItem if undefined.
#
# Mandatory: no
# Default:
# Hostname=

Hostname=Windows host
修改以上内容后即可使用zabbix agents,配置文件内还有许多参数可供自定义,具体请参阅文件内的注释。
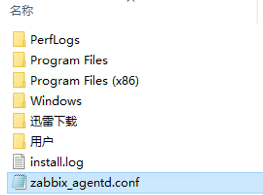
修改完成后将配置文件复制到windows系统盘的根目录下,我的系统根目录为C盘,所以我复制到C盘下,最后将配置文件重命名为zabbix_agentd.conf。
0x04 安装
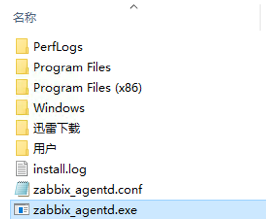
请根据系统位数,在bin文件夹中选择相应的可执行文件复制到系统盘根目录下,我的系统根目录为C盘,所以我复制到C盘下。
先运行CMD,然后将zabbix_agentd.exe可执行程序拖到CMD内并添加 -h 参数即可查看受支持的命令:
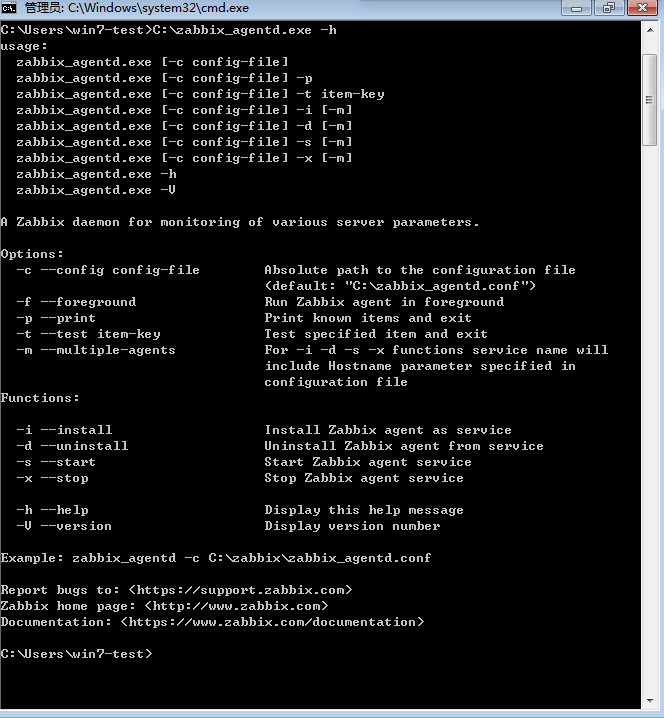
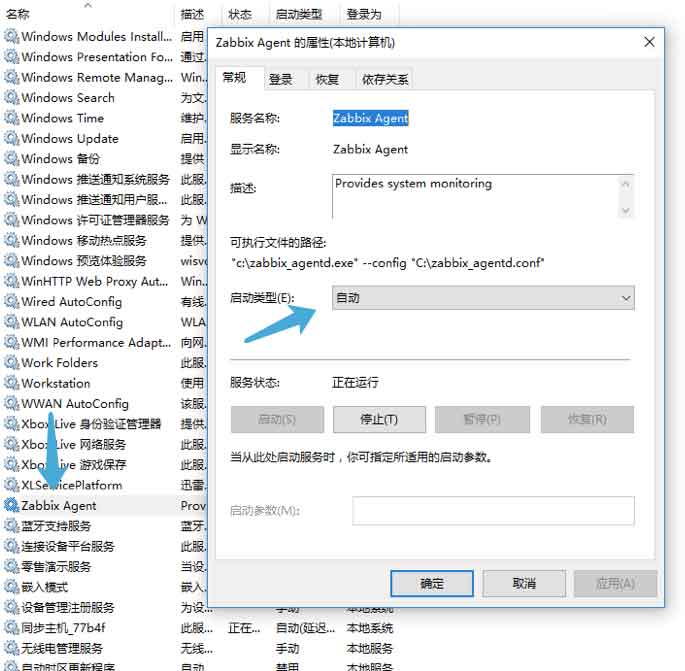
通过添加 -i 参数进行安装。该操作会在系统服务中添加一个名为Zabbix Agent的服务,启动类型为:自动:

0x05 防火墙
zabbix agents默认的端口为10050,如果需要修改,请到配置文件中的第93行手动添加一行参数以指定监听端口,修改端口后请手动重启zabbix agents服务:
### Option: ListenPort
#	Agent will listen on this port for connections from the server.
#
# Mandatory: no
# Range: 1024-32767
# Default:
# ListenPort=10050

ListenPort=10050
最后需要对系统的防火墙进行手动放行,以便服务端与agents进行链接。
0x06 添加监控点
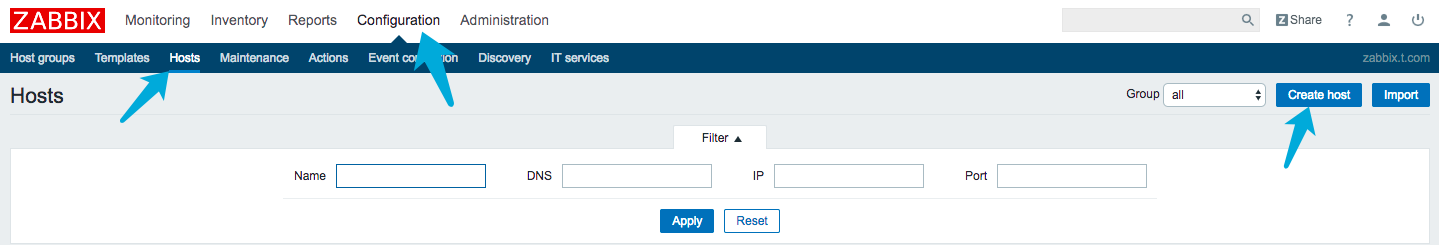
到zabbix管理页面Configuration > Hosts > Create Hosts创建监控点:
以下是Host配置界面:
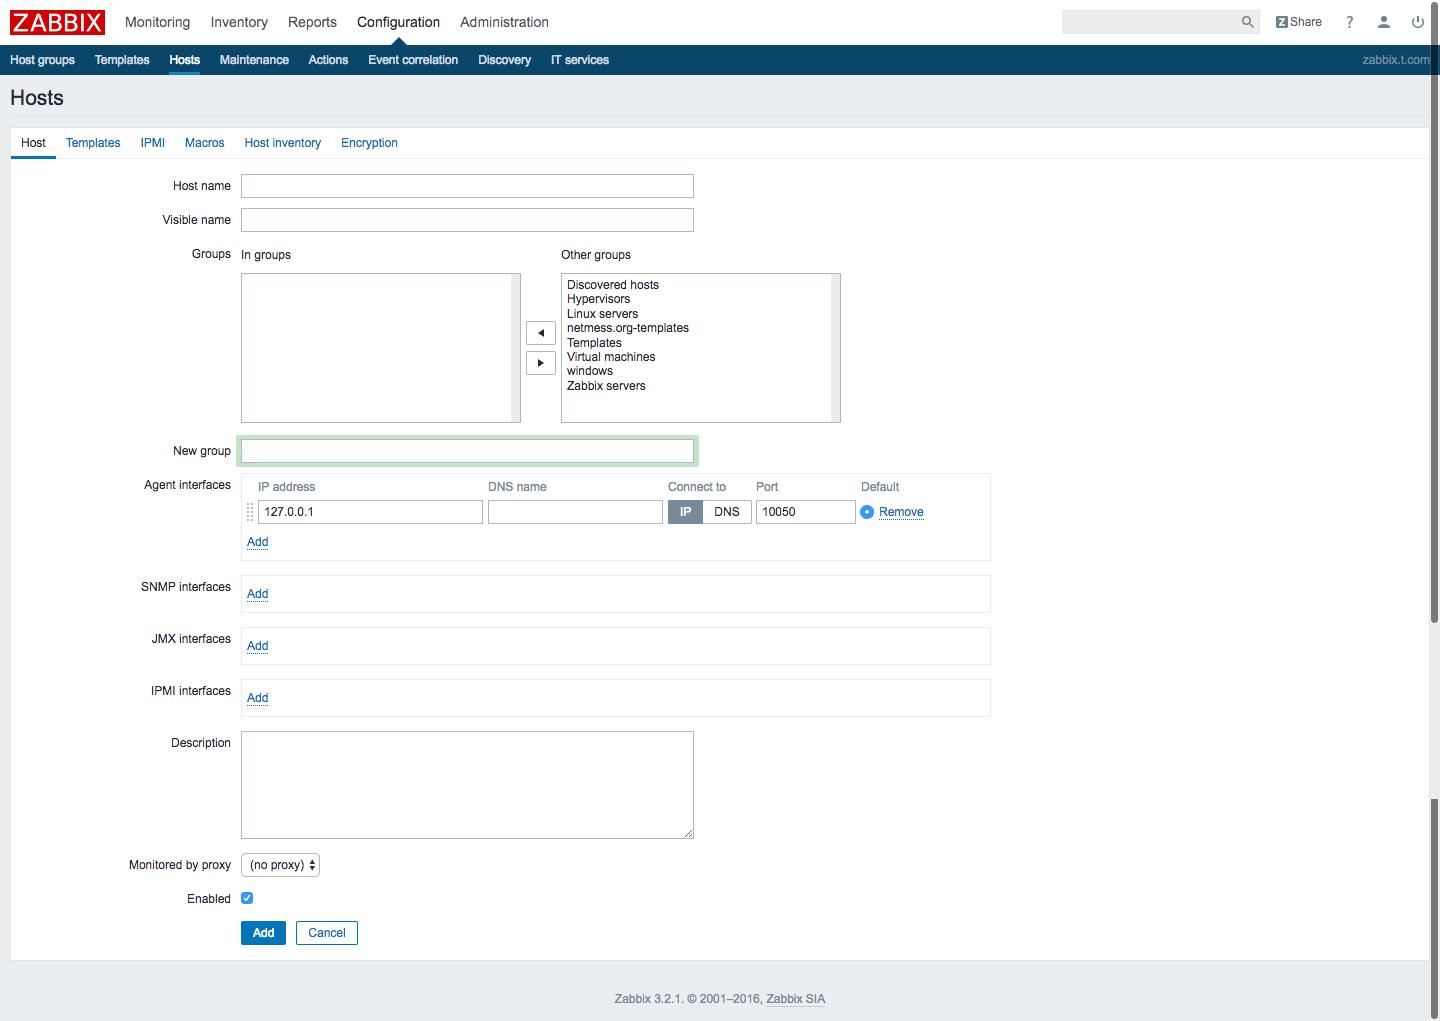
- Host name 填入主机名
- Visible name 填入用于展示的名称
- Groups 请选择组别
- Agent interfaces 请填入监控点的IP地址或域名
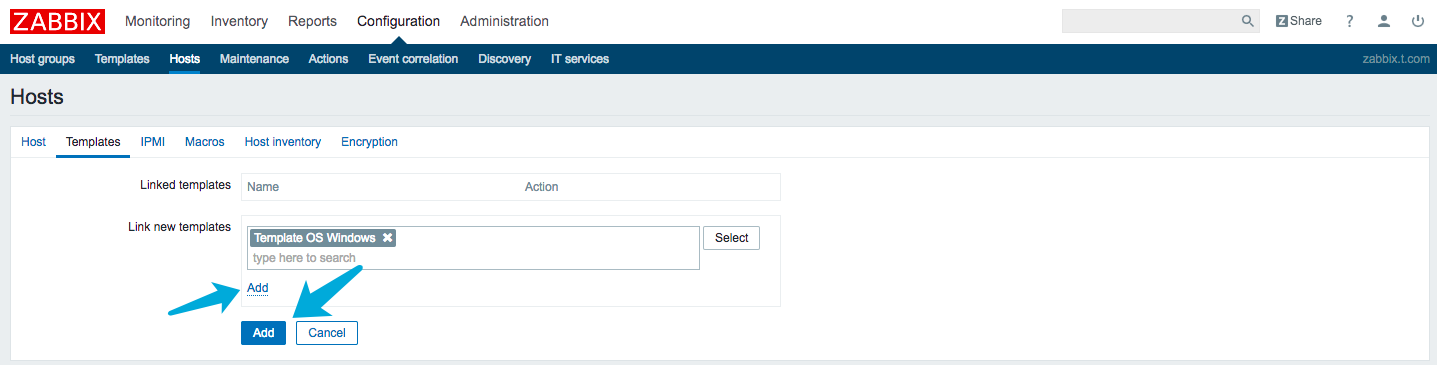
以下是Template配置界面:
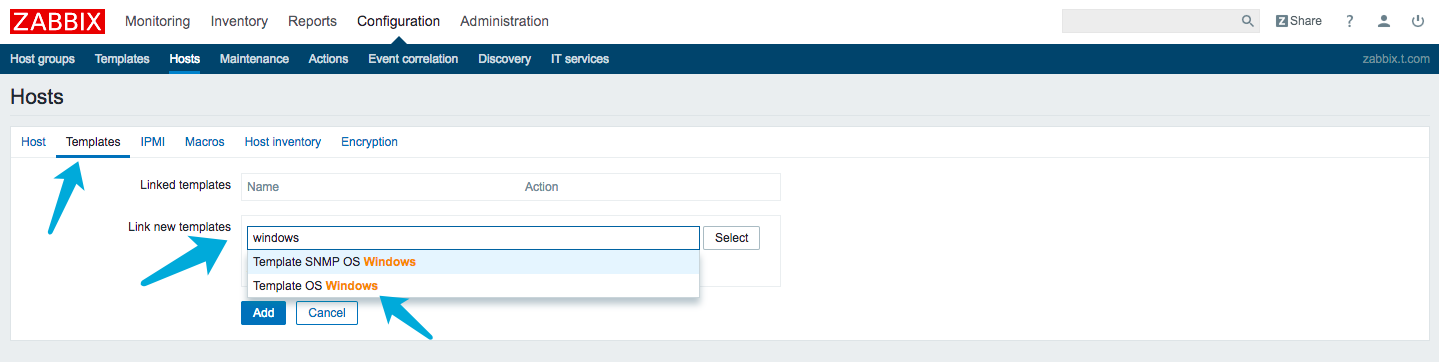
请在Link new templates框内输入windows并选择Template OS Windows。
这里要注意的是要先点选白底Add将模版添加到Linked templates中再点选蓝底Add添加监控点:
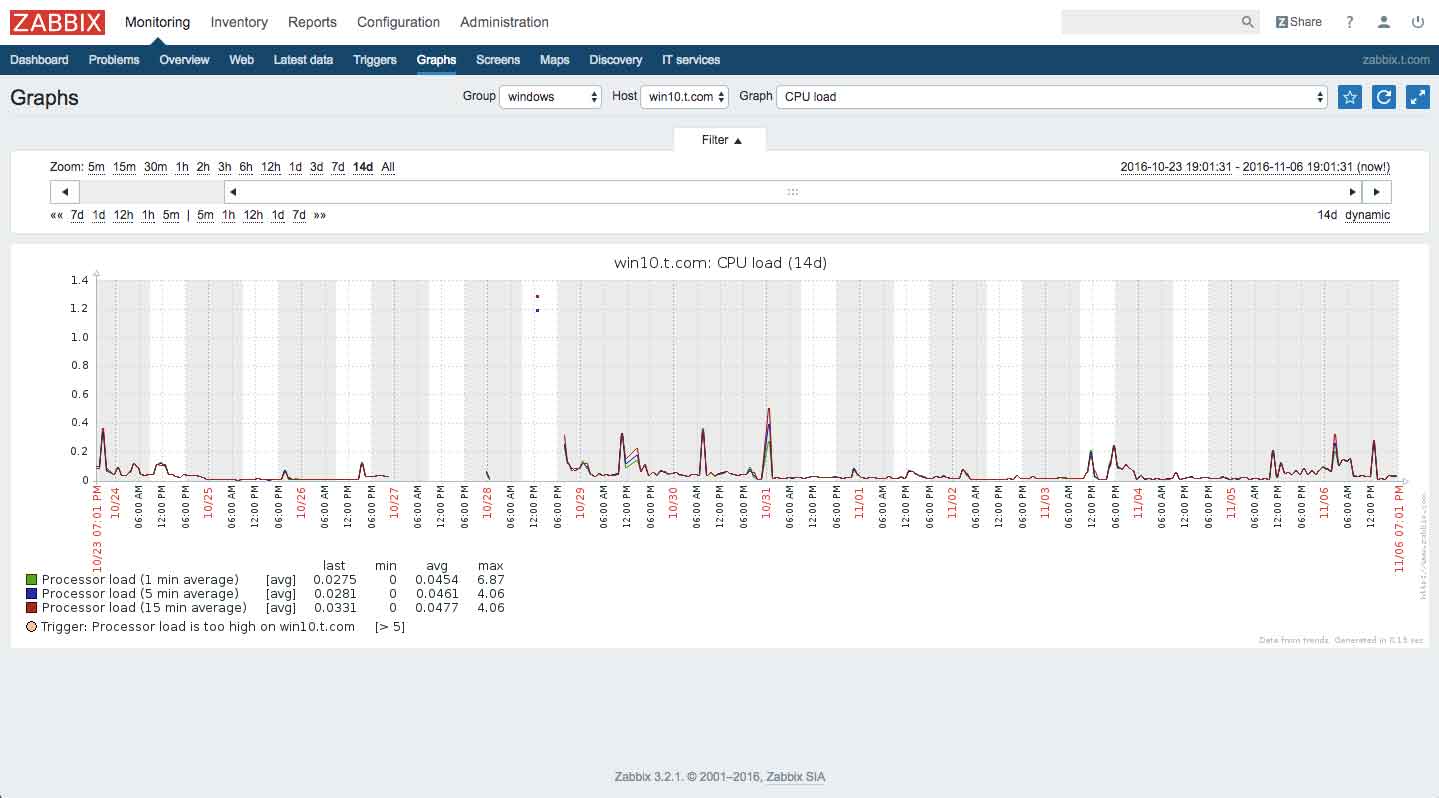
0x07 查看图表
添加完成后即可到Monitoring > Graphs 中选择相应的Group、Host 与Graph查看相应的图表:
0x08 结语
目前我我还没想到监控数据可以用来做那些分析,然而家里的服务器好像也没有可分析的项目。至少目前还没有。有问题欢迎在下面的留言栏给我留言。


")